In this post, we provide an analysis of Yahoo Q2 2015 earnings. Firstly, we provide an analysis of Yahoo revenues, revenue growth, profits, and profit margins. Then, we provide an analysis of Yahoo business segment revenues and geographic segment revenues. The data for the 5 quarters from Q2 2014 to Q2 2015 is presented in charts.
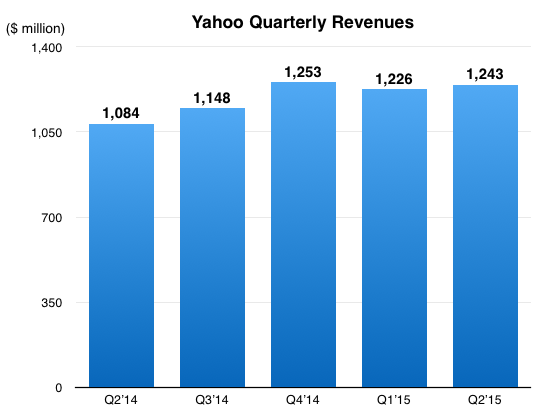
Yahoo Q2 2015 Revenues
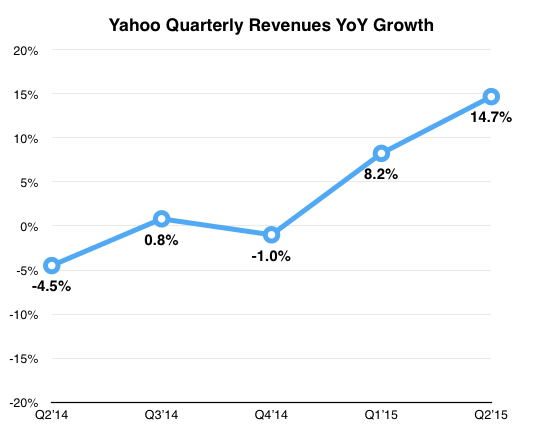
Yahoo Q2 2015 total revenues reached $1.24 billion. The revenues grew 14.7% YoY. This is the highest quarterly revenue YoY growth for Yahoo in the last nine years. On an overall network level, including Tumblr, more than 1 billion users use Yahoo across desktop and mobile. More than 600 million monthly active users access Yahoo through mobile.
Yahoo Q2 2015 Profits
Yahoo Q2 2015 operating losses were -$44.8 million. The Q2 2015 operating margin was -3.6%.
Yahoo continues to make investments in traffic acquisition and marketing to gain market share. Traffic acquisition costs during Q2 2015 were $200 million, up to $156 million compared to the previous year. The costs went up primarily due to Yahoo partnership with Mozilla Foundation, the BrightRoll and Flurry acquisitions, and continued momentum of mobile syndication.
Yahoo Q2 2015 net losses were -$21.6 million. The Q2 2015 net margin was -1.7%.
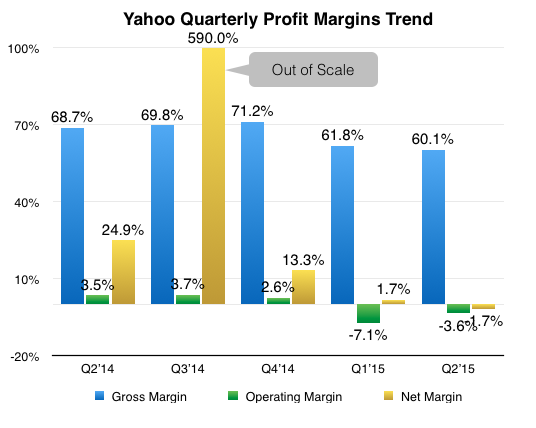
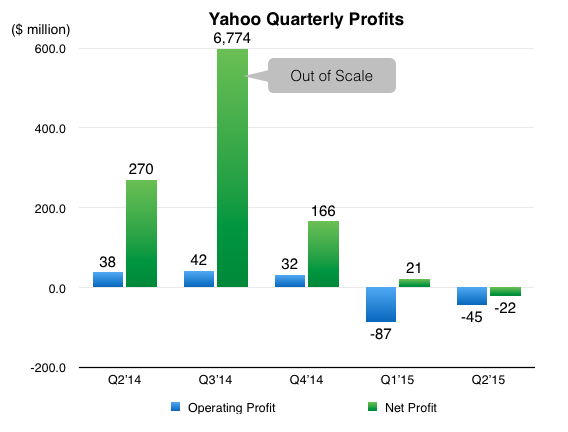
Note – Net income for the quarter Q3 2014 includes a gain from the sale of Alibaba Group shares of $6.3 billion.
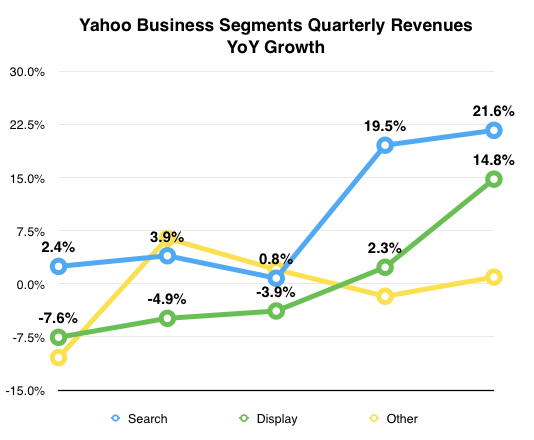
Yahoo Q2 2015 Business Segment Revenues
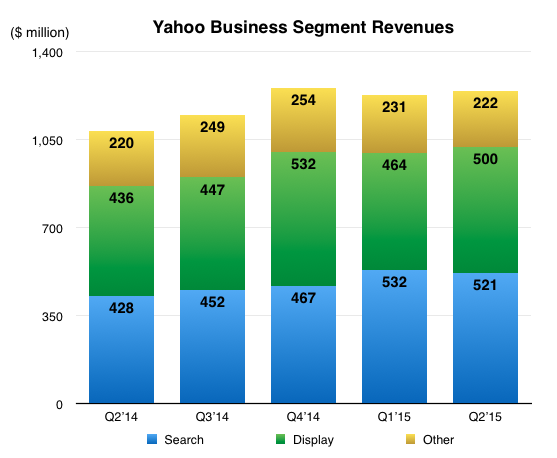
Yahoo Q2 2015 search advertising revenues reached $521.1 million, up 21.6% YoY. In Q2 2015, the number of paid search clicks was up 13% YoY. Search price-per-click (PPC) was up 4% YoY. Yahoo continues to invest in mobile search. In Q2 2015, Yahoo launched a new mobile search on the majority of its U.S. mobile search traffic.
Yahoo Q2 2015 display advertising revenues reached $500.4 million, up 14.8% YoY. In Q2 2015, the number of display ads impressions sold was up 9% YoY. Display price-per-ad (PPA) was up 10% YoY. The increase in display PPA was primarily driven by increases in native as well as video ads, which have a higher price-per-ad.
Yahoo Mavens businesses, which include mobile, video, native, and social, generated nearly $400 million in revenues in Q2 2015, up 60% YoY. Yahoo mobile revenues exceeded $250 million in Q2 2015, up 55% YoY.
Yahoo Q2 2015 other revenues reached $221.8 million, up 0.9% YoY.
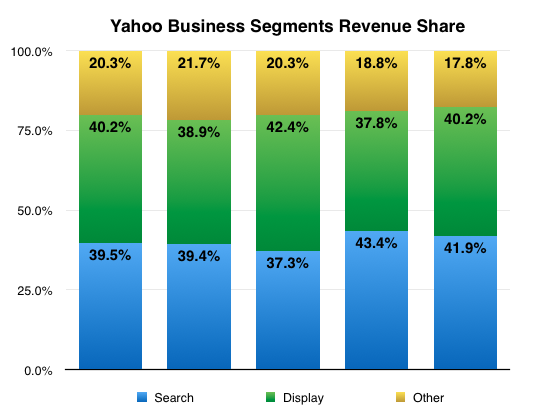
The share of search advertising revenues in the Yahoo total revenues during Q2 2015 was 41.9%. The share of display advertising revenues in the Yahoo total revenues during Q2 2015 was 40.2%. So, the share of total advertising revenues in the Yahoo total revenues during Q2 2015 was 82.2%. The share of other revenues in the Yahoo total revenues during Q2 2015 was 17.8%.
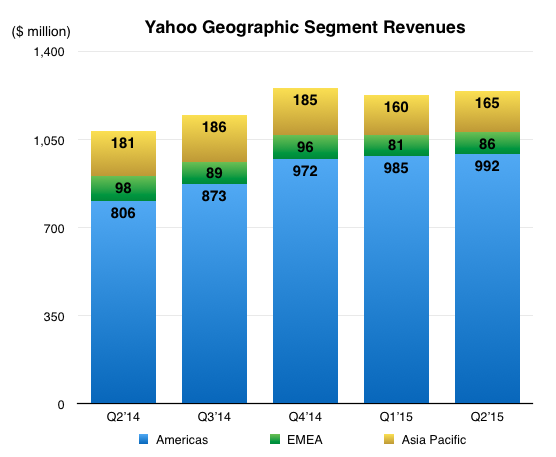
Yahoo Q2 2015 Geographic Segment Revenues
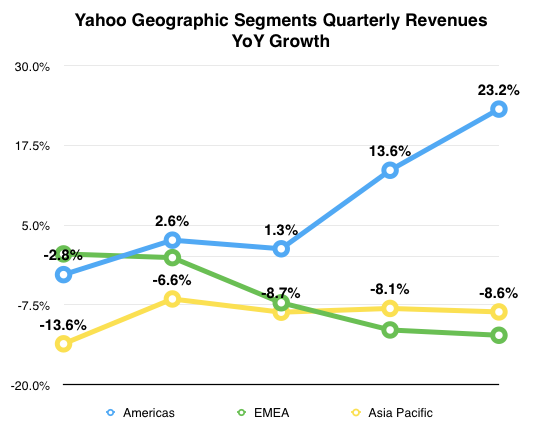
Yahoo Q2 2015 revenues from the Americas region reached $992.2 million, up 23.2% YoY.
Yahoo Q2 2015 revenues from the EMEA region reached $85.8 million, down -12.3% YoY.
Yahoo Q2 2015 revenues from the Asia Pacific region reached $165.2 million, down -8.6% YoY.
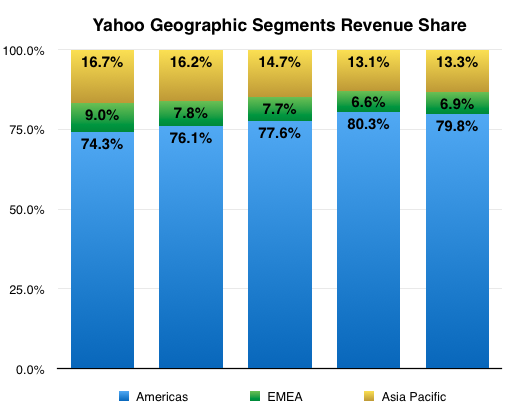
The share of America’s revenues in the Yahoo total revenues during Q2 2015 was 79.8%. The share of EMEA revenues in the Yahoo total revenues during Q2 2015 was 6.9%. The share of Asia Pacific revenues in the Yahoo total revenues during Q2 2015 was 13.3%.