
AT&T; Inc. provides telecommunications and digital entertainment services. The company operates through four segments: Business Solutions, Entertainment Group, Consumer Mobility, and International. The Business Solutions segment offers wireless, fixed strategic, legacy voice and data, wireless equipment, and other services to business, governmental, and wholesale customers, as well as individual subscribers. The Entertainment Group segment provides video entertainment and audio programming channels to approximately 25.3 million subscribers; broadband and Internet services to 12.9 million residential subscribers; local and long-distance voice services to residential customers, as well as DSL Internet access services; and voice services over IP-based technology, and technical support and other customer service functions and equipment. The Consumer Mobility segment offers wireless services to consumers, and wireless wholesale and resale subscribers, such as long-distance and roaming services. This segment provides postpaid and prepaid wireless voice and data communications services; consulting, advertising, and application and co-location services; and sells a variety of handsets, wirelessly enabled computers, and personal computer wireless data cards through company-owned stores, agents, or third-party retail stores, as well as accessories, such as carrying cases, hands-free devices, and other items. The International segment offers digital television services, including local and international digital-quality video entertainment and audio programming under the DIRECTV and SKY brands throughout Latin America. This segment also provides postpaid and prepaid wireless services to approximately 12.0 million subscribers under the AT&T; and Unefon brands; and sells a range of handsets. The company was formerly known as SBC Communications Inc. and changed its name to AT&T; Inc. in November 2005. AT&T; Inc. was founded in 1983 and is based in Dallas, Texas.
BUSINESS ANALYSIS OF AT&T
The Telecommunications Sector is witnessing a major shakeup, new age business models in the industry are transforming both customers and businesses. Faced with this uncertainity, companies are investing resources to transform their business. An in-depth business analysis is a valuable resource to identify and articulate the need for a business model change. At R&P Research we believe, the starting point for a business analysis is Benchmarking. Business benchmarking can be done at various levels: 1) Industry Benchmarking 2) Peer Benchmarking 3) Disruptors Benchmarking. In this report, we share the snapshot of how AT&T; compares against the industry on the major performance indicators. This analysis, along with peer group/disruptors benchmarking and revenue model understanding can help identify growth and cost optimization opportunities to maximize the value delivered by AT&T; to its stakeholders. R&P Research Industry Intelligence Platform provides historical data for last 15 years with an easy to use benchmarking interface for an in-depth comparative business analysis.
- Revenue Growth: AT&T; reported a revenue growth of 11.6% year-on-year during 2016. Telecom Services Industry grew at 8.6% in the same period
- COGS share of Revenues: As a percentage of revenue, AT&T; spent 35.5% of its total revenues on COGS. Telecom Services industry average (COGS share of revenue) in the same period was 37.8%
- R&D; share of Revenues: AT&T; R&D; share of Revenues details are not available because either company does not share the data or we do not have it
- SG&A; share of Revenues: As a percentage of revenue, AT&T; spent 22.2% of its total revenues on Sales, Marketing, and General Administration (SG&A;). Telecom Services industry average SG&A; spending in the same period was 26.6%
- Inventory share of Revenues: AT&T; Inventory share of Revenues details are not available because either company does not share the data or we do not have it
- Accounts Payable share of Revenues: As a percentage of revenue, AT&T; invested 20.8% of its total revenues on Accounts Payable (A/P) Telecom Services industry average Accounts Payable investment in the same period was 15.9%
- Accounts Receivable share of Revenues: As a percentage of revenue, AT&T; invested 10.3% of its total revenues on Accounts Receivable (A/R). Telecom Services industry average Accounts Receivable investment in the same period was 11.4%
- PP&E; share of Revenues: As a percentage of revenue, AT&T; invested 76.3% of its total revenues on Property, Plants, and Equipments (PP&E;). Telecom Services industry average PPE investment in the same period was 79.2%
- Intangibles share of Revenues: As a percentage of revenue, AT&T; invested 135.6% of its total revenues on Intangibles. Telecom Services industry average Intangibles investment in the same period was 116.1%
- Net Margins: AT&T; Net Margins in the year 2016 were 7.9%. Telecom Services industry average Net Margins in the same period were 6.9%

SECTOR AND INDUSTRY ASSOCIATION OF AT&T
For the purpose of performance benchmarking of a company with a sector or industry average, R&P; Research associates every company with one sector and one industry. An industry consists of companies with related/similar business models. A sector comprises of a group of related/similar industries.
AT&T; is associated with Telecommunications Sector and Telecom Services Industry.
Telecommunications sector is comprised of the following industries: Telecom Services; Communication Equipment. The definitions for each of the industries is as follows:
- Telecom Services industry includes providers of fixed-line and mobile telephone services.
- Communication Equipment industry includes providers of communication equipment to the telecom service providers. It also includes companies that own, operate, and lease mobile site towers to multiple wireless services providers.

INDUSTRY RANKING OF AT&T
With $163.8 billion revenues, AT&T; ranked number 1 of all the companies in the US Telecom Services industry. There were a total of 36 public companies in the US Telecom Services industry that had revenues greater than $50 million during 2016.
The top-10 companies in the US Telecom Services industry by revenues during 2016 were:
- AT&T; ($163.8 billion)
- Verizon ($126 billion)
- T-Mobile US ($37.2 billion)
- Sprint ($32.2 billion)
- Charter Communications ($29 billion)
- Liberty Global ($20 billion)
- CenturyLink ($17.5 billion)
- Dish Network ($15.1 billion)
- Frontier Communications ($8.9 billion)
- Level 3 Communications ($8.2 billion)
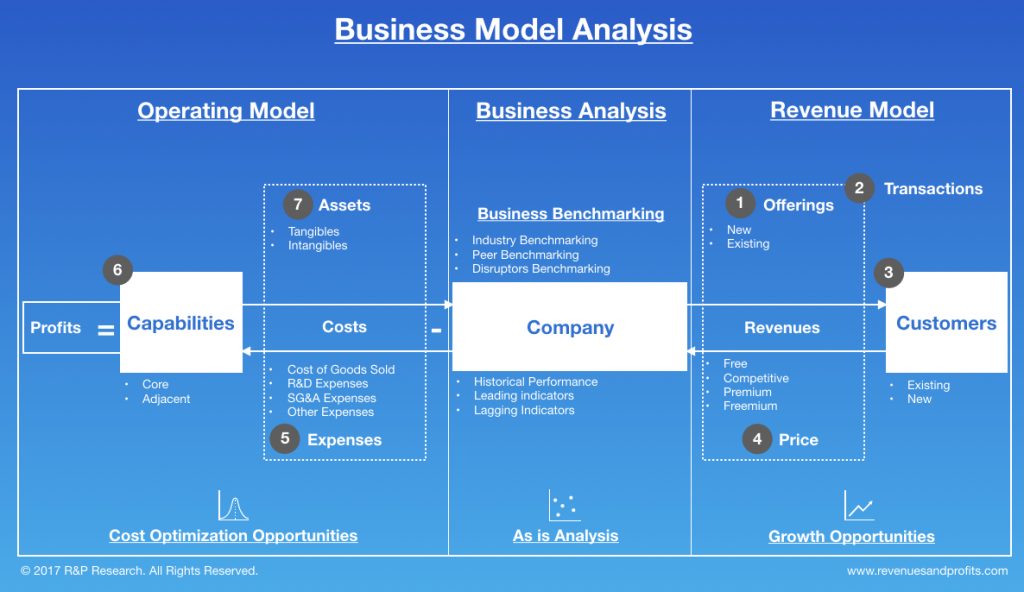
BUSINESS MODEL ANALYSIS (BMA) FRAMEWORK
We use the following framework to assess the business model of a company. Business Model Analysis framework can be used by organizations to articulate growth strategies and identify cost optimization opportunities. Technology and consulting companies can use this framework to identify the value drivers and pain points of their targeted customers. Entrepreneurs can use this framework to understand the language of business and identify promising business opportunities. This framework can be used by any professional aspiring to take up a leadership role to better understand the businesses challenges, articulate growth strategy, and monitor the business improvement requirements for the organization.
INDUSTRY PEERS AND COMPETITORS OF ATT

Verizon (VZ) Business Analysis – Analyze Historical Performance, Strategic Priorities, And…
Verizon Communications Inc with $126 billion revenues in the year 2016 was the number 2 Telecom Services company. Read this report to know the top competitors of Verizon and identify growth and cost optimization opportunities of Verizon
T-Mobile US (TMUS) Business Analysis – Analyze Historical Performance, Strategic Priorities,…
T-Mobile US, Inc. with $37 billion revenues in the year 2016 was the number 3 Telecom Services company. Read this report to know the top competitors of T-Mobile US and identify growth and cost optimization opportunities of T-Mobile US
Sprint (S) Business Analysis – Analyze Historical Performance, Strategic Priorities, And…
Sprint Corp with $32 billion revenues in the year 2016 was the number 4 Telecom Services company. Read this report to know the top competitors of Sprint and identify growth and cost optimization opportunities of Sprint
Charter Communications (CHTR) Business Analysis – Analyze Historical Performance, Strategic Priorities,…
Charter Communications, Inc. with $29 billion revenues in the year 2016 was the number 5 Telecom Services company. Read this report to know the top competitors of Charter Communications and identify growth and cost optimization opportunities of Charter Communications
Liberty Global (LBTYA) Business Analysis – Analyze Historical Performance, Strategic Priorities,…
Liberty Global Plc with $20 billion revenues in the year 2016 was the number 6 Telecom Services company. Read this report to know the top competitors of Liberty Global and identify growth and cost optimization opportunities of Liberty Global
CenturyLink (CTL) Business Analysis – Analyze Historical Performance, Strategic Priorities, And…
CenturyLink, Inc with $17 billion revenues in the year 2016 was the number 7 Telecom Services company. Read this report to know the top competitors of CenturyLink and identify growth and cost optimization opportunities of CenturyLink
REVENUES ANALYSIS

AT&T (T) Revenues And Revenue Growth From 2012 To 2016
This report provides the last five years revenues and revenue growth of AT&T; Inc. (T) from 2012 to 2016. AT&T; generated a total of $163.8 billion revenues during 2016. AT&T; reported a revenue growth of 11.6% year-over-year during 2016. The revenues and the revenue growth correspond to the fiscal year ending in December.
AT&T (T) Revenues And Revenue Growth From 2002 To 2016
This report provides the last fifteen years revenues and revenue growth of AT&T; Inc. (T) from 2002 to 2016. AT&T; generated a total of $163.8 billion revenues during 2016. AT&T; reported a revenue growth of 11.6% year-over-year during 2016. The revenues and the revenue growth correspond to the fiscal year ending in December.
AT&T (T) Revenue Growth Comparison With Industry Growth From 2012 To…
This report provides a comparison of AT&T; Inc. (T) revenue growth with Telecom Services industry growth during the last five years from 2012 to 2016. AT&T; reported a revenue growth of 11.6% year-over-year during 2016. The Telecom Services industry growth was 8.6% year-over-year during 2016. AT&T; growth was faster than the industry during 2016.
PROFIT ANALYSIS

AT&T (T) Net Profit And Net Margin From 2012 To 2016
This report provides the last five years net profit and net margin of AT&T; Inc. (T) from 2012 to 2016. AT&T; reported a total net income of $13 billion during 2016. AT&T; generated a total of $163.8 billion revenues during 2016. AT&T; net profit margin was 7.9% during 2016. The net profit and the net profit margin correspond to the fiscal year ending in December.
AT&T (T) Net Profit And Net Margin From 2002 To 2016
This report provides the last fifteen years net profit and net margin of AT&T; Inc. (T) from 2002 to 2016. AT&T; reported a total net income of $13 billion during 2016. AT&T; generated a total of $163.8 billion revenues during 2016. AT&T; net profit margin was 7.9% during 2016. The net profit and the net profit margin correspond to the fiscal year ending in December.
AT&T (T) Net Profit Margin Comparison With Industry From 2012 To…
This report provides a comparison of AT&T; Inc. (T) net profit margin with Telecom Services industry net profit margin during the last five years from 2012 to 2016. AT&T; reported a net profit margin of 7.9% during 2016. The Telecom Services industry net profit margin was 6.9% during 2016. AT&T; was more profitable than the industry during 2016.
COST & EXPENSES ANALYSIS

AT&T (T) Cost of Sales (COGS) Analysis From 2012 To 2016
This report provides the last five years cost of sales (COGS) analysis of AT&T; Inc. (T) from 2012 to 2016. AT&T; spent a total of $58.1 billion on COGS during 2016. AT&T; generated a total of $163.8 billion revenues during 2016. As a percentage of revenues, AT&T; spent 35.5% of its total revenues on COGS during 2016. The cost of sales (COGS) numbers are for the fiscal year ending in December.
AT&T (T) Research & Development (R&D) Spending Analysis 2016
R&D; spending analysis for AT&T; is not available because either the company does not provide the data or we don’t have it.
AT&T (T) Sales, Marketing, General & Administrative (SG&A) Spending Analysis From…
This report provides the last five years sales, marketing, general & administrative (SG&A;) expenses of AT&T; Inc. (T) from 2012 to 2016. AT&T; spent a total of $36.3 billion on sales, marketing, general, and administrative (SG&A;) activities during 2016. AT&T; generated a total of $163.8 billion revenues during 2016. As a percentage of revenues, AT&T; spent 22.2% of its total revenues on SG&A; activities during 2016. The SG&A; spending numbers are for the fiscal year ending in December.
WORKING CAPITAL ANALYSIS

AT&T (T) Inventory Spending Analysis 2016
Inventory spending analysis for AT&T; is not available because either the company does not provide the data or we don’t have it.
AT&T (T) Accounts Receivable (A/R) Analysis From 2012 To 2016
This report provides the last five years Accounts Receivable (A/R) analysis of AT&T; Inc. (T) from 2012 to 2016. AT&T; invested a total of $16.8 billion on accounts receivable during 2016. AT&T; generated a total of $163.8 billion revenues during 2016. As a percentage of revenues, AT&T; invested 10.3% of its total revenues on accounts receivable during 2016. The accounts receivable numbers are for the fiscal year ending in December.
AT&T (T) Accounts Payable (A/P) Analysis From 2012 To 2016
This report provides the last five years Accounts Payable (A/P) analysis of AT&T; Inc. (T) from 2012 to 2016. AT&T; invested a total of $34.1 billion on accounts payable during 2016. AT&T; generated a total of $163.8 billion revenues during 2016. As a percentage of revenues, AT&T; invested 20.8% of its total revenues on accounts payable activities during 2016. The accounts payable numbers are for the fiscal year ending in December.
ASSET MANAGEMENT ANALYSIS

AT&T (T) Property, Plant & Equipment (PP&E) Investment Analysis From 2012…
This report provides the last five years property, plant & equipment (PP&E;) investment analysis of AT&T; Inc. (T) from 2012 to 2016. AT&T; invested a total of $124.9 billion on property, plant & equipment (PP&E;) activities during 2016. AT&T; generated a total of $163.8 billion revenues during 2016. As a percentage of revenues, AT&T; invested 76.3% of its total revenues on PP&E; activities during 2016. The PP&E; investment numbers are for the fiscal year ending in December.
AT&T (T) Intangible Assets Analysis From 2012 To 2016
This report provides the last five years Intangible assets analysis of AT&T; Inc. (T) from 2012 to 2016. AT&T; invested a total of $222.1 billion on Intangible assets during 2016. AT&T; generated a total of $163.8 billion revenues during 2016. As a percentage of revenues, AT&T; invested 135.6% of its total revenues on intangible assets during 2016. The Intangible asset numbers are for the fiscal year ending in December.


