
Deluxe Corporation provides checks, forms, marketing solutions, accessories, and other products and services for small businesses and financial institutions. It operates through three segments: Small Business Services, Financial Services, and Direct Checks. The company provides checks; printed forms, such as deposit tickets, billing forms, work orders, job proposals, purchase orders, invoices, and personnel forms, as well as computer forms and check registers; and accessories and other products comprising envelopes, office supplies, stamps, and labels, as well as checkbook covers.
It also offers Web services, which include logo and Web design; hosting and other Web services; search engine optimization; and marketing programs, including email, mobile, and social media, and other self-service marketing solutions. In addition, the company provides fraud protection and security, online and offline payroll services, and electronic checks; and promotional solutions, such as postcards, brochures, retail packaging supplies, apparel, greeting cards, and business cards.
Further, it offers financial technology solutions to larger financial institutions, which comprise data-driven marketing solutions, including outsourced marketing campaign targeting and execution; treasury management solutions; and digital enablement solutions, including loyalty and rewards programs. It operates in the United States, Canada, Europe, and North and South America. The company was formerly known as Deluxe Check Printers, Incorporated and changed its name to Deluxe Corporation in 1988. Deluxe Corporation was founded in 1915 and is headquartered in Shoreview, Minnesota.
Deluxe
R&P Rank: 1002
Sector: Industrial Support Services
Industry: Business Services
H.Q Location: Minnesota
Website: www.deluxe.com
Company Address:
10 BURTON HILLS BLVD, N/A, NASHVILLE TN 37215
Ph:615-263-3000
Business Analysis Of Deluxe

The Industrial Support Services Sector is witnessing a major shakeup, new age business models in the industry are transforming both customers and businesses. Faced with this uncertainty, companies are investing resources to transform their business. In-Depth business analysis is a valuable resource to identify and articulate the need for a business model change. At R&P Research we believe, the starting point for a business analysis is Benchmarking. Business benchmarking can be done at various levels: 1) Industry Benchmarking 2) Peer Benchmarking 3) Disruptors Benchmarking. In this report, we share the snapshot of how Deluxe compares against the industry on the major performance indicators. This analysis, along with peer group/disruptors benchmarking and revenue model understanding can help identify growth and cost optimization opportunities to maximize the value delivered by Deluxe to its stakeholders. R&P Research Industry Intelligence Platform provides historical data for the last 15 years with an easy to use benchmarking interface for in-depth comparative business analysis.
Here is the performance snapshot of Deluxe with an interactive chart.
- Revenue Growth: Deluxe reported revenue growth of 4.3% year-on-year during 2016. Business Services Industry grew at 2.8% in the same period
- COGS share of Revenues: As a percentage of revenue, Deluxe spent 36.1% of its total revenues on COGS. Business Services industry average (COGS share of revenue) in the same period was 67.3%
- R&D; share of Revenues: Deluxe R&D; share of Revenues details are not available because either company does not share the data or we do not have it
- SG&A; share of Revenues: As a percentage of revenue, Deluxe spent 43.6% of its total revenues on Sales, Marketing, and General Administration (SG&A;). Business Services industry average SG&A; spending in the same period was 17.2%
- Inventory share of Revenues: As a percentage of revenue, Deluxe spent 2.2% of its total revenues on Inventories. Business Services industry average Inventory spending in the same period was 2.2%
- Accounts Payable share of Revenues: As a percentage of revenue, Deluxe invested 5.8% of its total revenues on Accounts Payable (A/P) Business Services industry average Accounts Payable investment in the same period was 7.0%
- Accounts Receivable share of Revenues: As a percentage of revenue, Deluxe invested 8.3% of its total revenues on Accounts Receivable (A/R). Business Services industry average Accounts Receivable investment in the same period was 17.2%
- PP&E; share of Revenues: As a percentage of revenue, Deluxe invested 4.7% of its total revenues on Property, Plants, and Equipment (PP&E;). Business Services industry average PPE investment in the same period was 39.9%
- Intangibles share of Revenues: As a percentage of revenue, Deluxe invested 82.0% of its total revenues on Intangibles. Business Services industry average Intangibles investment in the same period was 43.0%
- Net Margins: Deluxe Net Margins in the year 2016 were 12.4%. Business Services industry average Net Margins in the same period were 5.0%
For the purpose of performance benchmarking of a company with a sector or industry average, R&P; Research associates every company with one sector and one industry. An industry consists of companies with related/similar business models. A sector comprises of a group of related/similar industries. For high-level analysis purposes, related/similar sectors are grouped into sector groups.
Deluxe is associated with Industrials Sector Group, Industrial Support Services Sector, and Business Services Industry.
Industrial Support Services sector is comprised of the following industries: Business Services; Consulting Services, Training and Professional Services; Staffing & Outsourcing Services; Environmental Services. The definitions for each of the industries is as follows:
- Business Services industry includes providers of nonfinancial services to a wide range of industrial enterprises and governments. This industry includes providers of uniform companies, Staffing and Outsourcing companies, office cleaning services, and companies that install, service and monitor alarm and security systems.
- Consulting Services, Training and Professional Services industry includes companies that offer management consulting services to both public and Governmental agencies.
- Staffing & Outsourcing Services industry includes companies providing contract, temporary, as well as permanent staff to clients with specific employment requirements. These companies also provide payroll and human resources outsourcing solutions for small and medium-sized businesses.
- Environmental Services industry includes companies that provide consulting and services for pollution reduction and control, recycling, waste-to-energy conversion, and hazardous waste management.
-

Img Source: martechseries.com

With $1.8 billion revenues, Deluxe ranked number 19 of all the companies in the US Business Services industry. There were a total of 67 public companies in the US Business Services industry that had revenues greater than $50 million during 2016.
The top-10 companies in the US Business Services industry by revenues during 2016 were:
-
- RR Donnelley ($6.9 billion)
- Nielsen Holdings ($6.3 billion)
- United Rentals ($5.8 billion)
- ABM Industries ($5.1 billion)
- Cintas ($4.9 billion)
- Quad/Graphics ($4.3 billion)
- CSRA ($4.3 billion)
- LSC Communications ($3.7 billion)
- TriNet Group ($3.1 billion)
- Steelcase ($3.1 billion)
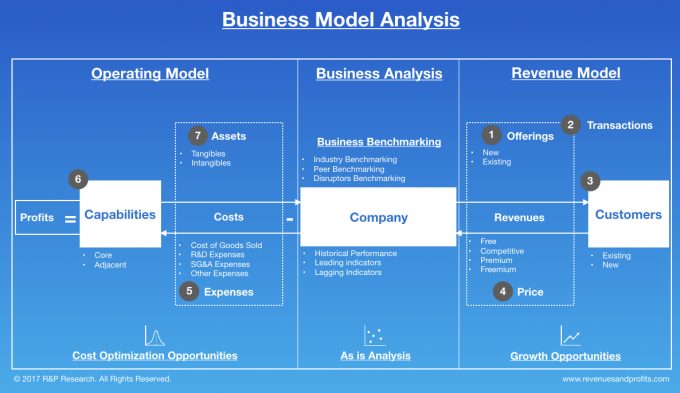
We use the following framework to assess the business model of a company. Business Model Analysis framework can be used by organizations to articulate growth strategies and identify cost optimization opportunities. Technology and consulting companies can use this framework to identify the value drivers and pain points of their targeted customers. Entrepreneurs can use this framework to understand the language of business and identify promising business opportunities. This framework can be used by any professional aspiring to take up a leadership role to better understand the business’s challenges, articulate growth strategy, and monitor the business improvement requirements for the organization.
Next Steps
- Conduct a holistic benchmarking; to identify and target additional sources of value
- Get in touch with us to learn more about Business Model Analysis Framework
- Get free data, charts, and analysis of Deluxe and its peers on select key performance indicators by clicking the reports provided below
Industry Peers And Competitors Of Deluxe
West Corp (WSTC) Business Analysis – Analyze Historical Performance, Strategic Priorities,…
West Corp with $2 billion in revenues in the year 2016 was the number 16 Business Services company. Read this report to know the top competitors of West Corp and identify growth and cost optimization opportunities of West Corp

HNI (HNI) Business Analysis – Analyze Historical Performance, Strategic Priorities, And…
HNI Corp with $2 billion in revenues in the year 2016 was the number 17 Business Services company. Read this report to know the top competitors of HNI and identify growth and cost optimization opportunities of HNI
Verisk Analytics (VRSK) Business Analysis – Analyze Historical Performance, Strategic Priorities,…
Verisk Analytics, Inc. with $2 billion in revenues in the year 2016 was the number 18 Business Services company. Read this report to know the top competitors of Verisk Analytics and identify growth and cost optimization opportunities of Verisk Analytics
Cenveo (CVO) Business Analysis – Analyze Historical Performance, Strategic Priorities, And…
Cenveo, Inc with $2 billion in revenues in the year 2016 was the number 20 Business Services company. Read this report to know the top competitors of Cenveo and identify growth and cost optimization opportunities of Cenveo.
SP Plus (SP) Business Analysis – Analyze Historical Performance, Strategic Priorities,…
SP Plus Corp with $2 billion in revenues in the year 2016 was the number 21 Business Services company. Read this report to know the top competitors of SP Plus and identify growth and cost optimization opportunities of SP Plus
Providence Service (PRSC) Business Analysis – Analyze Historical Performance, Strategic Priorities,…
Providence Service Corp with $2 billion in revenues in the year 2016 was the number 22 Business Services company. Read this report to know the top competitors of Providence Service and identify growth and cost optimization opportunities of Providence Service
Revenues Analysis

Deluxe (DLX) Revenues And Revenue Growth From 2012 To 2016
This report provides the last five years’ revenues and revenue growth of Deluxe Corp (DLX) from 2012 to 2016. Deluxe generated a total of $1.8 billion in revenues during 2016. Deluxe reported revenue growth of 4.3% year-over-year during 2016. The revenues and the revenue growth correspond to the fiscal year ending in December.
Deluxe (DLX) Revenues And Revenue Growth From 2002 To 2016
This report provides the last fifteen years’ revenues and revenue growth of Deluxe Corp (DLX) from 2002 to 2016. Deluxe generated a total of $1.8 billion in revenues during 2016. Deluxe reported revenue growth of 4.3% year-over-year during 2016. The revenues and the revenue growth correspond to the fiscal year ending in December.
Deluxe (DLX) Revenue Growth Comparison With Industry Growth From 2012 To…
This report provides a comparison of Deluxe Corp (DLX) revenue growth with the Business Services industry growth during the last five years from 2012 to 2016. Deluxe reported revenue growth of 4.3% year-over-year during 2016. The Business Services industry growth was 2.8% year-over-year during 2016. Deluxe’s growth was faster than the industry during 2016.
Profit Analysis

Deluxe (DLX) Net Profit And Net Margin From 2012 To 2016
This report provides the last five years net profit and a net margin of Deluxe Corp (DLX) from 2012 to 2016. Deluxe reported a total net income of $229.4 million during 2016. Deluxe generated a total of $1.8 billion in revenues during 2016. The deluxe net profit margin was 12.4% during 2016. The net profit and the net profit margin correspond to the fiscal year ending in December.
Deluxe (DLX) Net Profit And Net Margin From 2002 To 2016
This report provides the last fifteen years’ net profit and a net margin of Deluxe Corp (DLX) from 2002 to 2016. Deluxe reported a total net income of $229.4 million during 2016. Deluxe generated a total of $1.8 billion in revenues during 2016. The deluxe net profit margin was 12.4% during 2016. The net profit and the net profit margin correspond to the fiscal year ending in December.
Deluxe (DLX) Net Profit Margin Comparison With Industry From 2012 To…
This report provides a comparison of the Deluxe Corp (DLX) net profit margin with the Business Services industry net profit margin during the last five years from 2012 to 2016. Deluxe reported a net profit margin of 12.4% during 2016. The Business Services industry net profit margin was 5% during 2016. Deluxe was more profitable than the industry during 2016.
Cost & Expenses Analysis

Deluxe (DLX) Cost of Sales (COGS) Analysis From 2012 To 2016
This report provides the last five years’ cost of sales (COGS) analysis of Deluxe Corp (DLX) from 2012 to 2016. Deluxe spent a total of $667.2 million on COGS during 2016. Deluxe generated a total of $1.8 billion in revenues during 2016. As a percentage of revenues, Deluxe spent 36.1% of its total revenues on COGS during 2016. The cost of sales (COGS) numbers is for the fiscal year ending in December.
Deluxe (DLX) Research & Development (R&D) Spending Analysis 2016
R&D; spending analysis for Deluxe is not available because either the company does not provide the data or we don’t have it.
Deluxe (DLX) Sales, Marketing, General & Administrative (SG&A) Spending Analysis From…
This report provides the last five years of sales, marketing, general & administrative (SG&A;) expenses of Deluxe Corp (DLX) from 2012 to 2016. Deluxe spent a total of $806 million in sales, marketing, general, and administrative (SG&A;) activities during 2016. Deluxe generated a total of $1.8 billion in revenues during 2016. As a percentage of revenues, Deluxe spent 43.6% of its total revenues on SG&A; activities during 2016. The SG&A; spending numbers are for the fiscal year ending in December.
Working Capital Analysis

Deluxe (DLX) Inventory Spending Analysis From 2012 To 2016
This report provides the last five years’ inventory spending analysis of Deluxe Corp (DLX) from 2012 to 2016. Deluxe invested a total of $40.2 million on inventories during 2016. Deluxe generated a total of $1.8 billion in revenues during 2016. As a percentage of revenues, Deluxe invested 2.2% of its total revenues on inventories during 2016. The inventory numbers are for the fiscal year ending in December.
Deluxe (DLX) Accounts Receivable (A/R) Analysis From 2012 To 2016
This report provides the last five years Accounts Receivable (A/R) analysis of Deluxe Corp (DLX) from 2012 to 2016. Deluxe invested a total of $152.6 million on accounts receivable during 2016. Deluxe generated a total of $1.8 billion in revenues during 2016. As a percentage of revenues, Deluxe invested 8.3% of its total revenues on accounts receivable during 2016. The accounts receivable numbers are for the fiscal year ending in December.
Deluxe (DLX) Accounts Payable (A/P) Analysis From 2012 To 2016
This report provides the last five years’ Accounts Payable (A/P) analysis of Deluxe Corp (DLX) from 2012 to 2016. Deluxe invested a total of $106.8 million on accounts payable during 2016. Deluxe generated a total of $1.8 billion in revenues during 2016. As a percentage of revenues, Deluxe invested 5.8% of its total revenues on accounts payable activities during 2016. The accounts payable numbers are for the fiscal year ending in December.
Asset Management Analysis

Deluxe (DLX) Property, Plant & Equipment (PP&E) Investment Analysis From 2012…
This report provides the last five years of property, plant & equipment (PP&E;) investment analysis of Deluxe Corp (DLX) from 2012 to 2016. Deluxe invested a total of $86.9 million on property, plant & equipment (PP&E;) activities during 2016. Deluxe generated a total of $1.8 billion in revenues during 2016. As a percentage of revenues, Deluxe invested 4.7% of its total revenues on PP&E; activities during 2016. The PP&E; investment numbers are for the fiscal year ending in December.
Deluxe (DLX) Intangible Assets Analysis From 2012 To 2016
This report provides the last five years Intangible assets analysis of Deluxe Corp (DLX) from 2012 to 2016. Deluxe invested a total of $1.5 billion on Intangible assets during 2016. Deluxe generated a total of $1.8 billion in revenues during 2016. As a percentage of revenues, Deluxe invested 82% of its total revenues on intangible assets during 2016. The Intangible asset numbers are for the fiscal year ending in December.


