In this post, we provide an analysis of Facebook business for the year 2014. Firstly, we provide an analysis of Facebook revenues, revenue growth, operating profit, and operating profit margins. Then, we share revenues, revenue share, and revenue growth analysis of the Facebook business segments. The data for the years 2011 to 2014 is presented in charts.
Facebook 2014 Revenues and Profits Highlights
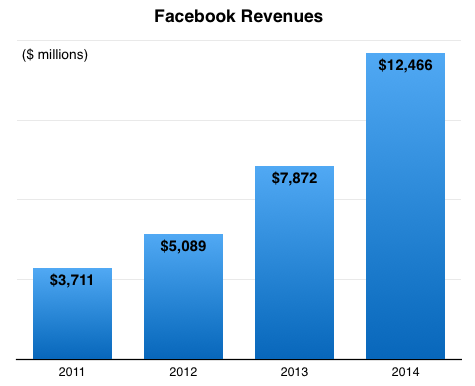
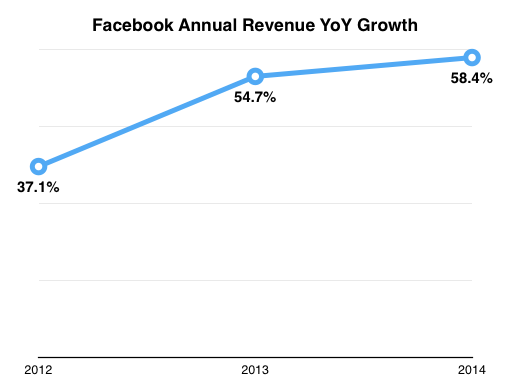
- 2014 Revenues: $12.47 billion. Up 58.4% YoY.
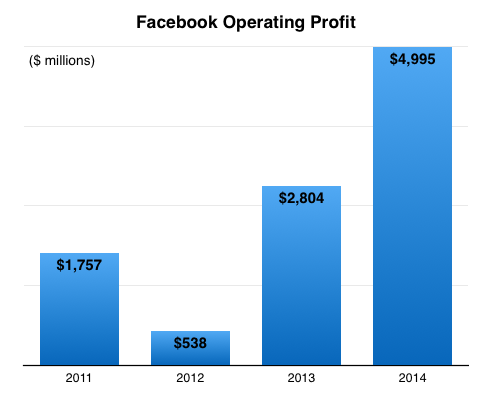
- 2014 Operating profit (loss): $4.99 billion.
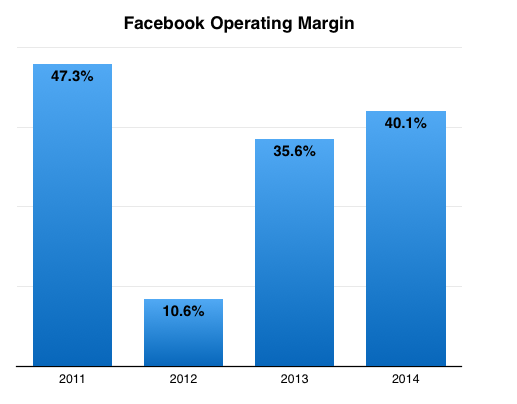
- 2014 Operating margin: 40.1%
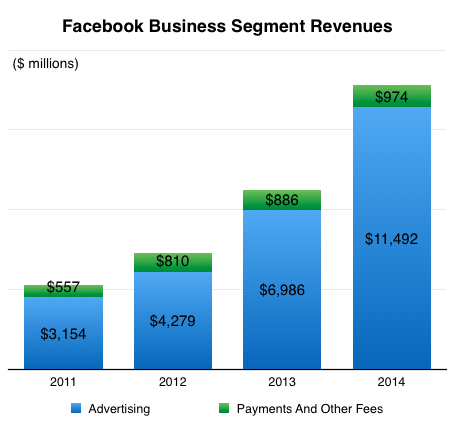
- Business segments: Advertising; Payment and other fees
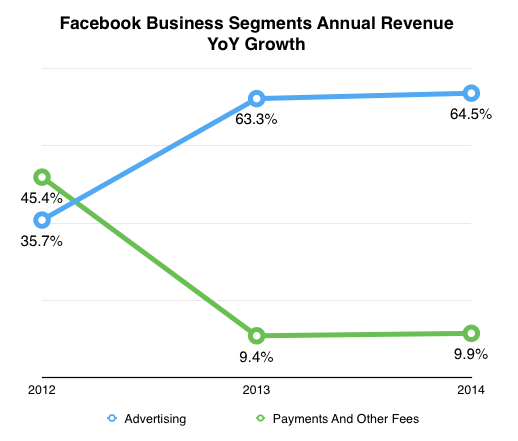
- 2014 Advertising business segment revenues: $11.49 billion. Up 64.5% YoY. Segment share – 92.2%.
- 2014 Payments and other fees business segment revenues: $974 million. Up 9.9% YoY. Segment share – 7.8%.
Facebook 2014 Revenues and Profits Charts