
This report provides the last five years revenues and revenue growth of Fitbit Inc (FIT) from 2012 to 2016. Fitbit generated a total of $2.2 billion revenues during 2016. Fitbit reported a revenue growth of 16.8% year-over-year during 2016. The revenues and the revenue growth correspond to the fiscal year ending in December.
FITBIT REVENUES FROM 2012 TO 2016
Here are the revenues and the revenue growth details of Fitbit during the last five years:
- Fitbit generated a total of $76.4 million revenues during 2012.
- Fitbit generated a total of $271.1 million revenues during 2013. Fitbit reported a revenue growth of 255% year-over-year during 2013.
- Fitbit generated a total of $745.4 million revenues during 2014. Fitbit reported a revenue growth of 175% year-over-year during 2014.
- Fitbit generated a total of $1.9 billion revenues during 2015. Fitbit reported a revenue growth of 149.3% year-over-year during 2015.
- Fitbit generated a total of $2.2 billion revenues during 2016. Fitbit reported a revenue growth of 16.8% year-over-year during 2016.
WHY ANALYZE REVENUE GROWTH?
Revenue growth is the most commonly analyzed financial metric. Revenue Growth is the percent increase (or decrease) of a company’s revenue between two time periods. It is computed by using the following formula: ((revenues during the time period two – revenues during the time period one) / revenues during the time period one)*100. If the time periods are two consecutive years, then the revenue growth is referred to as the annual revenue growth year-over-year. If the time periods are two consecutive quarters, then the revenue growth is referred to as the quarterly revenue growth quarter-over-quarter. If the time periods refer to the same quarter in the two consecutive years, then the revenue growth is referred to as quarterly revenue growth year-over-year. In case the time periods are two non-consecutive years, then the revenue CAGR (Commutative Annual Growth Rate) is computed.
Revenue growth analysis is important for a number of reasons. First, it helps in understanding how a business is performing. If the revenue growth rates are positive, it means the business is performing well and the revenues are increasing. If the revenue growth rates are negative, it means the revenues are declining and the company needs to take measures to increase them. If they don’t, the company will continue to shrink. Second, a company’s historical revenue growth analysis along with the market size and market share analysis helps in forecasting the future revenues of a company. Third, a comparison of a company’s growth rates with its competitors helps in determining who is winning more business. A revenue growth higher than the industry average translates into increasing market share. Companies with very high revenue growth rates have the potential to be the industry disrupters.
FITBIT RANKING
With $2.2 billion revenues, Fitbit ranked number 912 in the R&P; Research list of top-3000 public companies in the US by revenues during 2016. Each one of the top-3000 companies generated more than $50 million of annual revenues during 2016.
The top-20 companies in the US by revenues during 2016 were:
- Walmart ($482.1 billion)
- ExxonMobil ($226.1 billion)
- Berkshire Hathaway ($223.6 billion)
- Apple ($215.6 billion)
- McKesson ($190.9 billion)
- UnitedHealth Group ($184.8 billion)
- CVS Health ($177.5 billion)
- General Motors ($166.4 billion)
- AT&T; ($163.8 billion)
- Ford Motor ($151.8 billion)
- AmerisourceBergen ($146.8 billion)
- Amazon ($136 billion)
- Verizon ($126 billion)
- General Electric ($123.7 billion)
- Cardinal Health ($121.5 billion)
- Costco ($118.7 billion)
- Walgreens Boots Alliance ($117.4 billion)
- Chevron ($114.5 billion)
- Kroger ($109.8 billion)
- Express Scripts Holding ($100.3 billion)
For the purpose of performance benchmarking of a company with a sector or industry average, R&P; Research associates every company with one sector and one industry. An industry consists of companies with related/similar business models. A sector comprises of a group of related/similar industries. For example, Life Sciences sector is comprised of following industries: Pharmaceuticals; Medical Devices; Biotechnology; Diagnostics & Scientific Instruments.
Fitbit is associated with Technology Sector and Networking Equipment and Services Industry.
With $2.2 billion revenues, Fitbit ranked number 94 of all the companies in the US Technology sector. There were a total of 406 public companies in the US Technology sector that had revenues greater than $50 million during 2016.
The top-10 companies in the US Technology sector by revenues during 2016 were:
- Apple ($215.6 billion)
- Amazon ($136 billion)
- Alphabet ($90.3 billion)
- Microsoft ($85.3 billion)
- IBM ($79.9 billion)
- Intel ($59.4 billion)
- Hewlett Packard Enterprise ($50.1 billion)
- Cisco Systems ($49.2 billion)
- HP ($48.2 billion)
- Oracle ($37 billion)

Technology sector is comprised of the following industries: Computers Systems and Peripherals; Software; Semiconductor; IT Consulting and Outsourcing Services; Networking Equipment and Services; Internet; Other. The definitions for each of the industries is as follows:
- Computers Systems and Peripherals industry includes companies primarily engaged in manufacturing of personal computers, servers, mainframes, workstations, and other computer accessories and peripherals such as storage drives, mice, keyboards and printers. It also includes manufacturers of mobile phones and tablets.
- Software industry includes businesses providing software products such as operating systems, productivity suites, enterprise software, data and analysis software, advertising and marketing software, engineering and manufacturing software, networking software, and IT management software. It also includes companies providing industry-specific software focused on different sectors such as Financials, Automotive, Telecom, Utilities, Travel, Real Estate, Media, and Publishing.
- Semiconductor industry includes companies primarily engaged in manufacturing and distribution of semiconductor products such as microprocessors, chipsets, motherboards, flash memory, and wired and wireless connectivity products. It also includes companies that provide semiconductor equipment and services to the semiconductor industry.
- IT Consulting and Outsourcing Services industry includes companies primarily engaged in providing information technology consulting and outsourcing services to other businesses. The services include IT consulting, systems integration, application development and management, IT infrastructure management, and network operations management.
- Networking Equipment and Services industry includes companies primarily engaged in manufacturing and distribution of networking and communications equipment for transporting data, voice, and video traffic across intranets, extranets, and the Internet. The key products include routers and switches for local and wide-area networks, cable modems, teleconferencing equipment, and wireless access points.
- Internet industry includes Internet-based businesses providing products and services such as search engines, social networking, web hosting, email, domain name registration, and eCommerce. It also includes industry information/services portals focused on different sectors such as Financials, Automotive, Travel, Health, Real Estate, Media, and Publishing.
- Other industry includes companies providing products such as photocopiers, fax machines, point of sale machines, audio/video technologies, and video games. It also includes technology companies that are not part of other six technology industries.
With $2.2 billion revenues, Fitbit ranked number 6 of all the companies in the US Networking Equipment and Services industry. There were a total of 30 public companies in the US Networking Equipment and Services industry that had revenues greater than $50 million during 2016.
The top-10 companies in the US Networking Equipment and Services industry by revenues during 2016 were:
- Cisco Systems ($49.2 billion)
- Juniper Networks ($5 billion)
- Garmin ($3 billion)
- Ciena ($2.6 billion)
- Brocade Communications Systems ($2.3 billion)
- Fitbit ($2.2 billion)
- HC2 Holdings ($1.6 billion)
- Netgear ($1.3 billion)
- Finisar ($1.3 billion)
- GoPro ($1.2 billion)

COMPANIES SEGMENTATION
To identify and analyze high/low growth or most/least profitable similar-size companies in different sectors or industries, R&P; research classifies all companies into different segments based upon their revenues, revenue growth, and net profit margins.
Based upon their annual revenues, the companies are classified into one of the following four segments:
- Mega companies, having revenues greater than $50 billion.
- Very Large companies, having revenues between $10 billion and $50 billion.
- Large companies, having revenues between $1 billion and $10 billion.
- Mid-size companies, having revenues between $50 million and $1 billion.
With $2.2 billion revenues, Fitbit was in the Large companies revenue segment during 2016. There were a total of 1097 companies in the Large companies revenue segment during 2016.
Based upon their annual revenue growth, the companies are classified into one of the following eight segments:
- Very High positive growth companies, having annual revenue growth greater than 50%.
- High positive growth companies, having annual revenue growth between 20% and 50%.
- Medium positive growth companies, having annual revenue growth between 5% and 20%.
- Low positive growth companies, having annual revenue growth between 0% and 5%.
- Low negative growth companies, having annual revenue growth between -5% and 0%.
- Medium negative growth companies, having annual revenue growth between -20% and -5%.
- High negative growth companies, having annual revenue growth between -50% and -20%.
- Very High negative growth companies, having annual revenue growth less than -50%.
With 16.8% revenue growth year-over-year, Fitbit was in the Medium positive revenue growth segment during 2016. There were a total of 876 companies in the Medium positive revenue growth segment during 2016. Of the US top-3000 companies, 1985 (nearly two-third of the total) had positive revenue growth and 1015 (nearly one-third of the total) had negative revenue growth during 2016.
Based upon their annual net profit margin, the companies are classified into one of the following eight segments:
- Very High positive margin companies, having net profit margin greater than 50%.
- High positive margin companies, having net profit margin between 20% and 50%.
- Medium positive margin companies, having net profit margin between 5% and 20%.
- Low positive margin companies, having net profit margin between 0% and 5%.
- Low negative margin companies, having net profit margin between -5% and 0%.
- Medium negative margin companies, having net profit margin between -20% and -5%.
- High negative margin companies, having net profit margin between -50% and -20%.
- Very High negative margin companies, having net profit margin less than -50%.
With a net margin of -4.7%, Fitbit was in the Low negative net profit margin segment during 2016. There were a total of 249 companies in the Low negative net profit margin segment during 2016. Of the US top-3000 companies, 2244 (nearly three-fourth of the total) had positive net profit margin and 756 (nearly one-fourth of the total) had negative net profit margin during 2016.
COMPANY BUSINESS SUMMARY
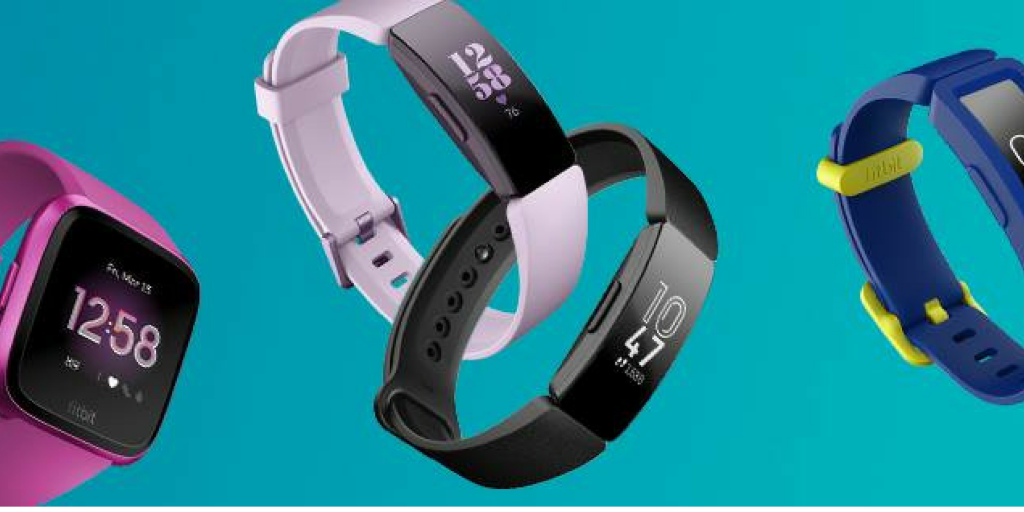
Fitbit, Inc. designs and sells connected health and fitness tracking devices. The company offers Fitbit Zip, an entry-level wireless activity tracker that allows users to track daily activity statistics, such as steps, distance, calories burned, and active minutes; Fitbit One, a clippable wireless tracker, which tracks floors climbed and sleep, as well as daily steps, distance, calories burned, and active minutes; and Fitbit Flex 2, a water-resistant fitness wristband that tracks pool swims comprising laps, duration, and calories burned in the Fitbit App. It also provides Fitbit Alta, a customizable wristband that offers call, text, and calendar notifications when paired with the user’s phone and SmartTrack automatic exercise recognition; Fitbit Charge 2, a wireless heart rate and activity wristband; Fitbit Blaze, a smart fitness watch that provides multi-sport functionality, tracks outdoor cycling activity, and run cues; and Fitbit Surge, a fitness watch that features a GPS watch, heart rate tracker, activity tracker, and smartwatch. In addition, the company offers Aria, a Wi-Fi connected scale that tracks weight, body fat percentage, and BMI. Further, it provides Fitbit Accessories that include bands and frames for Fitbit Blaze; bands for Fitbit Charge 2, Fitbit Alta, and Fitbit Flex 2; bangles and pendants for Fitbit Flex 2; colored clips for Fitbit One and Fitbit Zip; and device charging cables, wireless sync dongles, band clasps, sleep bands, and Fitbit apparel. It provides its products through consumer electronics and specialty, e-commerce, mass merchant, department store, club, and sporting goods and outdoors retailers; wireless carriers and distributors; and corporate wellness channels, as well as directly worldwide. The company was formerly known as Healthy Metrics Research, Inc. and changed its name to Fitbit, Inc. in October 2007. Fitbit, Inc. was founded in 2007 and is headquartered in San Francisco, California.
INDUSTRY PEERS AND COMPETITORS OF FITBIT
 Business Analysis – Analyze Historical Performance, Strategic Priorities, And Business Improvement Opportunities of Garmin")
Garmin (GRMN) Business Analysis – Analyze Historical Performance, Strategic Priorities, And…
Garmin Ltd with $3 billion revenues in the year 2016 was the number 3 Networking Equipment and Services company. Read this report to know the top competitors of Garmin and identify growth and cost optimization opportunities of Garmin
Ciena (CIEN) Business Analysis – Analyze Historical Performance, Strategic Priorities, And…
Ciena Corp with $3 billion revenues in the year 2016 was the number 4 Networking Equipment and Services company. Read this report to know the top competitors of Ciena and identify growth and cost optimization opportunities of Ciena
Brocade Communications Systems (BRCD) Business Analysis – Analyze Historical Performance, Strategic…
Brocade Communications Systems Inc with $2 billion revenues in the year 2016 was the number 5 Networking Equipment and Services company. Read this report to know the top competitors of Brocade Communications Systems and identify growth and cost optimization opportunities of Brocade Communications Systems
 Business Analysis – Analyze Historical Performance, Strategic Priorities, And Business Improvement Opportunities of HC2 Holdings")
HC2 Holdings (HCHC) Business Analysis – Analyze Historical Performance, Strategic Priorities,…
HC2 Holdings, Inc. with $2 billion revenues in the year 2016 was the number 7 Networking Equipment and Services company. Read this report to know the top competitors of HC2 Holdings and identify growth and cost optimization opportunities of HC2 Holdings
Netgear (NTGR) Business Analysis – Analyze Historical Performance, Strategic Priorities, And…
Netgear, Inc with $1 billion revenues in the year 2016 was the number 8 Networking Equipment and Services company. Read this report to know the top competitors of Netgear and identify growth and cost optimization opportunities of Netgear
Finisar (FNSR) Business Analysis – Analyze Historical Performance, Strategic Priorities, And…
Finisar Corp with $1 billion revenues in the year 2016 was the number 9 Networking Equipment and Services company. Read this report to know the top competitors of Finisar and identify growth and cost optimization opportunities of Finisar
REVENUES ANALYSIS
 Revenues And Revenue Growth From 2012 To 2016")
Fitbit (FIT) Revenues And Revenue Growth From 2012 To 2016
This report provides the last five years revenues and revenue growth of Fitbit Inc (FIT) from 2012 to 2016. Fitbit generated a total of $2.2 billion revenues during 2016. Fitbit reported a revenue growth of 16.8% year-over-year during 2016. The revenues and the revenue growth correspond to the fiscal year ending in December.
Fitbit (FIT) Revenue Growth Comparison With Industry Growth From 2013 To…
This report provides a comparison of Fitbit Inc (FIT) revenue growth with Networking Equipment and Services industry growth during the last four years from 2013 to 2016. Fitbit reported a revenue growth of 16.8% year-over-year during 2016. The Networking Equipment and Services industry growth was 3.1% year-over-year during 2016. Fitbit growth was faster than the industry during 2016.
PROFIT ANALYSIS
 Net Profit And Net Margin From 2014 To 2016")
Fitbit (FIT) Net Profit And Net Margin From 2014 To 2016
This report provides the last three years net profit and net margin of Fitbit Inc (FIT) from 2014 to 2016. Fitbit reported a total net income of -$102.8 million during 2016. Fitbit generated a total of $2.2 billion revenues during 2016. Fitbit net profit margin was -4.7% during 2016. The net profit and the net profit margin correspond to the fiscal year ending in December.
Fitbit (FIT) Net Profit And Net Margin From 2012 To 2016
This report provides the last five years net profit and net margin of Fitbit Inc (FIT) from 2012 to 2016. Fitbit reported a total net income of -$102.8 million during 2016. Fitbit generated a total of $2.2 billion revenues during 2016. Fitbit net profit margin was -4.7% during 2016. The net profit and the net profit margin correspond to the fiscal year ending in December.
Fitbit (FIT) Net Profit Margin Comparison With Industry From 2012 To…
This report provides a comparison of Fitbit Inc (FIT) net profit margin with Networking Equipment and Services industry net profit margin during the last five years from 2012 to 2016. Fitbit reported a net profit margin of -4.7% during 2016. The Networking Equipment and Services industry net profit margin was 14.4% during 2016. Fitbit was less profitable than the industry during 2016.
COST & EXPENSES ANALYSIS
 Cost of Sales (COGS) Analysis From 2012 To 2016")
Fitbit (FIT) Cost of Sales (COGS) Analysis From 2012 To 2016
This report provides the last five years cost of sales (COGS) analysis of Fitbit Inc (FIT) from 2012 to 2016. Fitbit spent a total of $1.3 billion on COGS during 2016. Fitbit generated a total of $2.2 billion revenues during 2016. As a percentage of revenues, Fitbit spent 61% of its total revenues on COGS during 2016. The cost of sales (COGS) numbers are for the fiscal year ending in December.
Fitbit (FIT) Research & Development (R&D) Spending Analysis From 2012 To…
This report provides the last five years research and development (R&D;) expenses of Fitbit Inc (FIT) from 2012 to 2016. Fitbit spent a total of $320.2 million on research and development (R&D;) activities during 2016. Fitbit generated a total of $2.2 billion revenues during 2016. As a percentage of revenues, Fitbit spent 14.8% of its total revenues on R&D; activities during 2016. The R&D; spending numbers are for the fiscal year ending in December.
Fitbit (FIT) Sales, Marketing, General & Administrative (SG&A) Spending Analysis From…
This report provides the last five years sales, marketing, general & administrative (SG&A;) expenses of Fitbit Inc (FIT) from 2012 to 2016. Fitbit spent a total of $638.2 million on sales, marketing, general, and administrative (SG&A;) activities during 2016. Fitbit generated a total of $2.2 billion revenues during 2016. As a percentage of revenues, Fitbit spent 29.4% of its total revenues on SG&A; activities during 2016. The SG&A; spending numbers are for the fiscal year ending in December.
WORKING CAPITAL ANALYSIS
 Inventory Spending Analysis From 2013 To 2016")
Fitbit (FIT) Inventory Spending Analysis From 2013 To 2016
This report provides the last four years inventory spending analysis of Fitbit Inc (FIT) from 2013 to 2016. Fitbit invested a total of $230.4 million on inventories during 2016. Fitbit generated a total of $2.2 billion revenues during 2016. As a percentage of revenues, Fitbit invested 10.6% of its total revenues on inventories during 2016. The inventory numbers are for the fiscal year ending in December.
Fitbit (FIT) Accounts Receivable (A/R) Analysis From 2013 To 2016
This report provides the last four years Accounts Receivable (A/R) analysis of Fitbit Inc (FIT) from 2013 to 2016. Fitbit invested a total of $477.8 million on accounts receivable during 2016. Fitbit generated a total of $2.2 billion revenues during 2016. As a percentage of revenues, Fitbit invested 22% of its total revenues on accounts receivable during 2016. The accounts receivable numbers are for the fiscal year ending in December.
Fitbit (FIT) Accounts Payable (A/P) Analysis From 2013 To 2016
This report provides the last four years Accounts Payable (A/P) analysis of Fitbit Inc (FIT) from 2013 to 2016. Fitbit invested a total of $313.8 million on accounts payable during 2016. Fitbit generated a total of $2.2 billion revenues during 2016. As a percentage of revenues, Fitbit invested 14.5% of its total revenues on accounts payable activities during 2016. The accounts payable numbers are for the fiscal year ending in December.
ASSET MANAGEMENT ANALYSIS
 Property, Plant & Equipment (PP&E) Investment Analysis From 2013 To 2016")
Fitbit (FIT) Property, Plant & Equipment (PP&E) Investment Analysis From 2013…
This report provides the last four years property, plant & equipment (PP&E;) investment analysis of Fitbit Inc (FIT) from 2013 to 2016. Fitbit invested a total of $76.6 million on property, plant & equipment (PP&E;) activities during 2016. Fitbit generated a total of $2.2 billion revenues during 2016. As a percentage of revenues, Fitbit invested 3.5% of its total revenues on PP&E; activities during 2016. The PP&E; investment numbers are for the fiscal year ending in December.
Fitbit (FIT) Intangible Assets Analysis From 2015 To 2016
This report provides the last two years Intangible assets analysis of Fitbit Inc (FIT) from 2015 to 2016. Fitbit invested a total of $78.6 million on Intangible assets during 2016. Fitbit generated a total of $2.2 billion revenues during 2016. As a percentage of revenues, Fitbit invested 3.6% of its total revenues on intangible assets during 2016. The Intangible asset numbers are for the fiscal year ending in December.


