
Gilead Sciences, Inc. discovers, develops, and commercializes medicines in the areas of unmet medical needs in Europe, North America, Asia, South America, Africa, Australia, India, and the Middle East.
The company’s products include Descovy, Odefsey, Genvoya, Stribild, Complera/Eviplera, Atripla, Truvada, Viread, Emtriva, Tybost, and Vitekta for the treatment of human immunodeficiency virus (HIV) infection in adults; and Vemlidy, Epclusa, Harvoni, Sovaldi, Viread, and Hepsera products for treating liver diseases. It also offers Zydelig, a PI3K delta inhibitor, in combination with rituximab, for the treatment of certain blood cancers; Letairis, an endothelin receptor antagonist for the treatment of pulmonary arterial hypertension; Ranexa, a tablet used for the treatment of chronic angina; Lexiscan/Rapiscan injection for use as a pharmacologic stress agent in radionuclide myocardial perfusion imaging; Cayston, an inhaled antibiotic for the treatment of respiratory systems in cystic fibrosis patients; and Tamiflu, an oral antiviral capsule for the treatment and prevention of influenza A and B. In addition, the company provides other products, such as AmBisome, an antifungal agent to treat serious invasive fungal infections; and Macugen, an anti-angiogenic oligonucleotide to treat neovascular age-related macular degeneration.
Further, it has product candidates in various stages of development for the treatment of HIV/AIDS and liver diseases, such as hepatitis C virus and hepatitis B virus; hematology/oncology; cardiovascular; and inflammation/respiratory diseases.
The company markets its products through its commercial teams and/or in conjunction with third-party distributors and corporate partners. Gilead Sciences, Inc. has collaboration agreements with Bristol-Myers Squibb Company, Janssen R&D; Ireland, Galapagos NV., and Spring Bank Pharmaceuticals, Inc. The company was founded in 1987 and is headquartered in Foster City, California.
BUSINESS ANALYSIS OF GILEAD SCIENCES
The Life Sciences Sector is witnessing a major shakeup, new age business models in the industry are transforming both customers and businesses. Faced with this uncertainity, companies are investing resources to transform their business. An in-depth business analysis is a valuable resource to identify and articulate the need for a business model change.
At R&P Research we believe, the starting point for a business analysis is Bench marking. Business bench marking can be done at various levels: 1) Industry Bench marking 2) Peer Bench marking 3) Disruptions Bench marking. In this report, we share the snapshot of how Gilead Sciences compares against the industry on the major performance indicators. This analysis, along with peer group/disruptions bench marking and revenue model understanding can help identify growth and cost optimization opportunities to maximize the value delivered by Gilead Sciences to its stakeholders.
R&P Research Industry Intelligence Platform provides historical data for last 15 years with an easy to use bench marking interface for an in-depth comparative business analysis.
- Revenue Growth: Gilead Sciences reported a revenue growth of -6.9% year-on-year during 2016. Biotechnology Industry grew at 7.0% in the same period
- COGS share of Revenues: As a percentage of revenue, Gilead Sciences spent 14.0% of its total revenues on COGS. Biotechnology industry average (COGS share of revenue) in the same period was 15.0%
- R&D; share of Revenues: As a percentage of revenue, Gilead Sciences spent 16.8% of its total revenues on R&D.; Biotechnology industry average R&D; spending in the same period was 23.7%
- SG&A; share of Revenues: As a percentage of revenue, Gilead Sciences spent 11.2% of its total revenues on Sales, Marketing, and General Administration (SG&A;). Biotechnology industry average SG&A; spending in the same period was 20.7%
- Inventory share of Revenues: As a percentage of revenue, Gilead Sciences spent 5.2% of its total revenues on Inventories. Biotechnology industry average Inventory spending in the same period was 7.5%
- Accounts Payable share of Revenues: As a percentage of revenue, Gilead Sciences invested 4.0% of its total revenues on Accounts Payable (A/P) Biotechnology industry average Accounts Payable investment in the same period was 11.8%
- Accounts Receivable share of Revenues: As a percentage of revenue, Gilead Sciences invested 14.9% of its total revenues on Accounts Receivable (A/R). Biotechnology industry average Accounts Receivable investment in the same period was 16.6%
- PP&E; share of Revenues: As a percentage of revenue, Gilead Sciences invested 9.4% of its total revenues on Property, Plants, and Equipment’s (PP&E;). Biotechnology industry average PPE investment in the same period was 17.0%
- Intangibles share of Revenues: As a percentage of revenue, Gilead Sciences invested 33.4% of its total revenues on Intangibles. Biotechnology industry average Intangibles investment in the same period was 96.4%
- Net Margins: Gilead Sciences Net Margins in the year 2016 were 44.4%. Biotechnology industry average Net Margins in the same period were 26.6%

SECTOR AND INDUSTRY ASSOCIATION OF GILEAD SCIENCES
For the purpose of performance bench marking of a company with a sector or industry average, R&P; Research associates every company with one sector and one industry. An industry consists of companies with related/similar business models. A sector comprises of a group of related/similar industries. For high-level analysis purposes, related/similar sectors are grouped into sector groups.
Gilead Sciences is associated with Healthcare Sector Group, Life Sciences Sector and Biotechnology Industry.
Life Sciences sector is comprised of the following industries: Pharmaceuticals; Medical Devices; Biotechnology; Diagnostics & Scientific Instruments. The definitions for each of the industries is as follows:
- Pharmaceuticals industry includes companies that discover, develop, manufacture, and market medicines licensed for use as medications. In general these companies offer pharmaceutical products that can be described as prescription or over-the-counter medicines. Many Pharmaceutical companies also offer a diverse portfolio of animal health products, services and solutions. Many diversified pharmaceutical companies operate in more than two operating segments like consumer health products, medical devices and pharmaceutical.
- Medical Devices industry includes manufacturers and distributors of medical equipment’s and medical supplies. Medical equipment’s include large scale capital equipment such as X-Ray machines and MRI scanners and other non disposable medical devices like stents and pacemakers. Medical supplies include makers of contact lenses, eyeglass lenses, bandages and other disposable products.
- Biotechnology industry includes Biotechnology product companies, subscription companies, and service companies. Biotechnology product companies offer pharmaceutical medication products that are manufactured in, extracted from, or semi synthesized from biological sources. Subscription-based companies develop genome databases, which can be used to develop medications. Service companies offer solutions based on a common technology or generic tool of other large pharmaceutical or biopharmaceutical companies.
- Diagnostics & Scientific Instruments industry includes companies that provide testing products, diagnostic reagents, instruments and diagnostic services to aid in the detection and treatment of a wide range of diseases. It also includes molecular diagnostic and genetic testing companies that develop, manufacture, market and provide diagnostic tests, diagnostic systems and related products and services. Also included are companies that manufacture and market analytical instruments, equipment, reagents and consumables, software and services for research, manufacturing, analysis, discovery and diagnostics. Find diagnostic tests examples here

INDUSTRY RANKING OF GILEAD SCIENCES
With $30.4 billion revenues, Gilead Sciences ranked number 1 of all the companies in the US Biotechnology industry. There were a total of 45 public companies in the US Biotechnology industry that had revenues greater than $50 million during 2016.
The top-10 companies in the US Biotechnology industry by revenues during 2016 were:
- Gilead Sciences ($30.4 billion)
- Abbvie ($25.6 billion)
- Amgen ($23 billion)
- Biogen ($11.4 billion)
- Celgene ($11.2 billion)
- Regeneron ($4.9 billion)
- Alexion Pharmaceuticals ($3.1 billion)
- Vertex Pharmaceuticals ($1.7 billion)
- United Therapeutics ($1.6 billion)
- BioMarin Pharmaceutical ($1.1 billion)
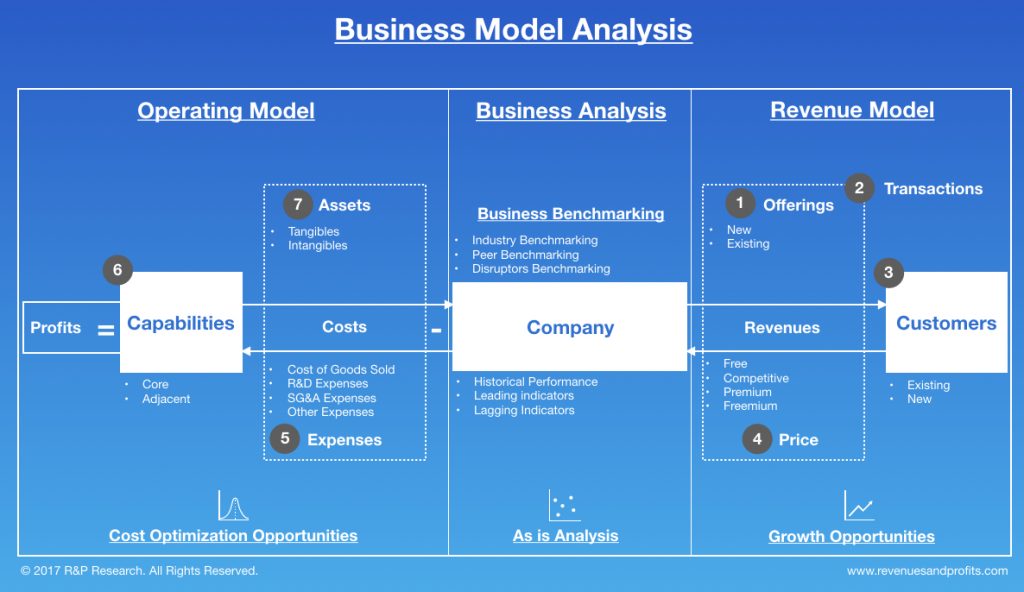
BUSINESS MODEL ANALYSIS (BMA) FRAMEWORK
We use the following framework to assess the business model of a company. Business Model Analysis framework can be used by organizations to articulate growth strategies and identify cost optimization opportunities. Technology and consulting companies can use this framework to identify the value drivers and pain points of their targeted customers. Entrepreneurs can use this framework to understand the language of business and identify promising business opportunities. This framework can be used by any professional aspiring to take up a leadership role to better understand the businesses challenges, articulate growth strategy, and monitor the business improvement requirements for the organization.
INDUSTRY PEERS AND COMPETITORS OF GILEAD-SCIENCES
Abbvie (ABBV) Business Analysis – Analyze Historical Performance, Strategic Priorities, And…
Abbvie Inc. with $26 billion revenues in the year 2016 was the number 2 Biotechnology company. Read this report to know the top competitors of Abbvie and identify growth and cost optimization opportunities of Abbvie

Amgen (AMGN) Business Analysis – Analyze Historical Performance, Strategic Priorities, And…
Amgen Inc with $23 billion revenues in the year 2016 was the number 3 Biotechnology company. Read this report to know the top competitors of Amgen and identify growth and cost optimization opportunities of Amgen
Biogen (BIIB) Business Analysis – Analyze Historical Performance, Strategic Priorities, And…
Biogen Inc. with $11 billion revenues in the year 2016 was the number 4 Biotechnology company. Read this report to know the top competitors of Biogen and identify growth and cost optimization opportunities of Biogen
Celgene (CELG) Business Analysis – Analyze Historical Performance, Strategic Priorities, And…
Celgene Corp with $11 billion revenues in the year 2016 was the number 5 Biotechnology company. Read this report to know the top competitors of Celgene and identify growth and cost optimization opportunities of Celgene
Regeneron (REGN) Business Analysis – Analyze Historical Performance, Strategic Priorities, And…
Regeneron Pharmaceuticals Inc with $5 billion revenues in the year 2016 was the number 6 Biotechnology company. Read this report to know the top competitors of Regeneron and identify growth and cost optimization opportunities of Regeneron
Alexion Pharmaceuticals (ALXN) Business Analysis – Analyze Historical Performance, Strategic Priorities,…
Alexion Pharmaceuticals Inc with $3 billion revenues in the year 2016 was the number 7 Biotechnology company. Read this report to know the top competitors of Alexion Pharmaceuticals and identify growth and cost optimization opportunities of Alexion Pharmaceuticals
REVENUES ANALYSIS

Gilead Sciences (GILD) Revenues And Revenue Growth From 2012 To 2016
This report provides the last five years revenues and revenue growth of Gilead Sciences Inc (GILD) from 2012 to 2016. Gilead Sciences generated a total of $30.4 billion revenues during 2016. Gilead Sciences reported a revenue growth of -6.9% year-over-year during 2016. The revenues and the revenue growth correspond to the fiscal year ending in December.
Gilead Sciences (GILD) Revenues And Revenue Growth From 2002 To 2016
This report provides the last fifteen years revenues and revenue growth of Gilead Sciences Inc (GILD) from 2002 to 2016. Gilead Sciences generated a total of $30.4 billion revenues during 2016. Gilead Sciences reported a revenue growth of -6.9% year-over-year during 2016. The revenues and the revenue growth correspond to the fiscal year ending in December.
Gilead Sciences (GILD) Revenue Growth Comparison With Industry Growth From 2012…
This report provides a comparison of Gilead Sciences Inc (GILD) revenue growth with Biotechnology industry growth during the last five years from 2012 to 2016. Gilead Sciences reported a revenue growth of -6.9% year-over-year during 2016. The Biotechnology industry growth was 7% year-over-year during 2016. Gilead Sciences growth was slower than the industry during 2016.
PROFIT ANALYSIS

Gilead Sciences (GILD) Net Profit And Net Margin From 2012 To…
This report provides the last five years net profit and net margin of Gilead Sciences Inc (GILD) from 2012 to 2016. Gilead Sciences reported a total net income of $13.5 billion during 2016. Gilead Sciences generated a total of $30.4 billion revenues during 2016. Gilead Sciences net profit margin was 44.4% during 2016. The net profit and the net profit margin correspond to the fiscal year ending in December.
Gilead Sciences (GILD) Net Profit And Net Margin From 2002 To…
This report provides the last fifteen years net profit and net margin of Gilead Sciences Inc (GILD) from 2002 to 2016. Gilead Sciences reported a total net income of $13.5 billion during 2016. Gilead Sciences generated a total of $30.4 billion revenues during 2016. Gilead Sciences net profit margin was 44.4% during 2016. The net profit and the net profit margin correspond to the fiscal year ending in December.
Gilead Sciences (GILD) Net Profit Margin Comparison With Industry From 2012…
This report provides a comparison of Gilead Sciences Inc (GILD) net profit margin with Biotechnology industry net profit margin during the last five years from 2012 to 2016. Gilead Sciences reported a net profit margin of 44.4% during 2016. The Biotechnology industry net profit margin was 26.6% during 2016. Gilead Sciences was more profitable than the industry during 2016.
COST EXPENSES ANALYSIS

Gilead Sciences (GILD) Cost of Sales (COGS) Analysis From 2012 To…
This report provides the last five years cost of sales (COGS) analysis of Gilead Sciences Inc (GILD) from 2012 to 2016. Gilead Sciences spent a total of $4.3 billion on COGS during 2016. Gilead Sciences generated a total of $30.4 billion revenues during 2016. As a percentage of revenues, Gilead Sciences spent 14% of its total revenues on COGS during 2016. The cost of sales (COGS) numbers are for the fiscal year ending in December.
Gilead Sciences (GILD) Research & Development (R&D) Spending Analysis From 2012…
This report provides the last five years research and development (R&D;) expenses of Gilead Sciences Inc (GILD) from 2012 to 2016. Gilead Sciences spent a total of $5.1 billion on research and development (R&D;) activities during 2016. Gilead Sciences generated a total of $30.4 billion revenues during 2016. As a percentage of revenues, Gilead Sciences spent 16.8% of its total revenues on R&D; activities during 2016. The R&D; spending numbers are for the fiscal year ending in December.
Gilead Sciences (GILD) Sales, Marketing, General & Administrative (SG&A) Spending Analysis…
This report provides the last five years sales, marketing, general & administrative (SG&A;) expenses of Gilead Sciences Inc (GILD) from 2012 to 2016. Gilead Sciences spent a total of $3.4 billion on sales, marketing, general, and administrative (SG&A;) activities during 2016. Gilead Sciences generated a total of $30.4 billion revenues during 2016. As a percentage of revenues, Gilead Sciences spent 11.2% of its total revenues on SG&A; activities during 2016. The SG&A; spending numbers are for the fiscal year ending in December.
WORKING CAPITAL ANALYSIS

Gilead Sciences (GILD) Inventory Spending Analysis From 2012 To 2016
This report provides the last five years inventory spending analysis of Gilead Sciences Inc (GILD) from 2012 to 2016. Gilead Sciences invested a total of $1.6 billion on inventories during 2016. Gilead Sciences generated a total of $30.4 billion revenues during 2016. As a percentage of revenues, Gilead Sciences invested 5.2% of its total revenues on inventories during 2016. The inventory numbers are for the fiscal year ending in December.
Gilead Sciences (GILD) Accounts Receivable (A/R) Analysis From 2012 To 2016
This report provides the last five years Accounts Receivable (A/R) analysis of Gilead Sciences Inc (GILD) from 2012 to 2016. Gilead Sciences invested a total of $4.5 billion on accounts receivable during 2016. Gilead Sciences generated a total of $30.4 billion revenues during 2016. As a percentage of revenues, Gilead Sciences invested 14.9% of its total revenues on accounts receivable during 2016. The accounts receivable numbers are for the fiscal year ending in December.
Gilead Sciences (GILD) Accounts Payable (A/P) Analysis From 2012 To 2016
This report provides the last five years Accounts Payable (A/P) analysis of Gilead Sciences Inc (GILD) from 2012 to 2016. Gilead Sciences invested a total of $1.2 billion on accounts payable during 2016. Gilead Sciences generated a total of $30.4 billion revenues during 2016. As a percentage of revenues, Gilead Sciences invested 4% of its total revenues on accounts payable activities during 2016. The accounts payable numbers are for the fiscal year ending in December.
ASSET MANAGEMENT ANALYSIS

Gilead Sciences (GILD) Property, Plant & Equipment (PP&E) Investment Analysis From…
This report provides the last five years property, plant & equipment (PP&E;) investment analysis of Gilead Sciences Inc (GILD) from 2012 to 2016. Gilead Sciences invested a total of $2.9 billion on property, plant & equipment (PP&E;) activities during 2016. Gilead Sciences generated a total of $30.4 billion revenues during 2016. As a percentage of revenues, Gilead Sciences invested 9.4% of its total revenues on PP&E; activities during 2016. The PP&E; investment numbers are for the fiscal year ending in December.
Gilead Sciences (GILD) Intangible Assets Analysis From 2012 To 2016
This report provides the last five years Intangible assets analysis of Gilead Sciences Inc (GILD) from 2012 to 2016. Gilead Sciences invested a total of $10.1 billion on Intangible assets during 2016. Gilead Sciences generated a total of $30.4 billion revenues during 2016. As a percentage of revenues, Gilead Sciences invested 33.4% of its total revenues on intangible assets during 2016. The Intangible asset numbers are for the fiscal year ending in December.


