
In this article, we will share insights from our analysis of the Google advertising revenues and the combined advertising revenue of US Top-10 Media companies – Comcast Corporation, The Walt Disney Company, Twenty-First Century Fox, CBS Corporation, Viacom, Time Warner, News Corporation, Discovery Communications, Scripps Networks Interactive, and Gannett Co.
Advertising and non-advertising revenue of Google and US top-10 media companies
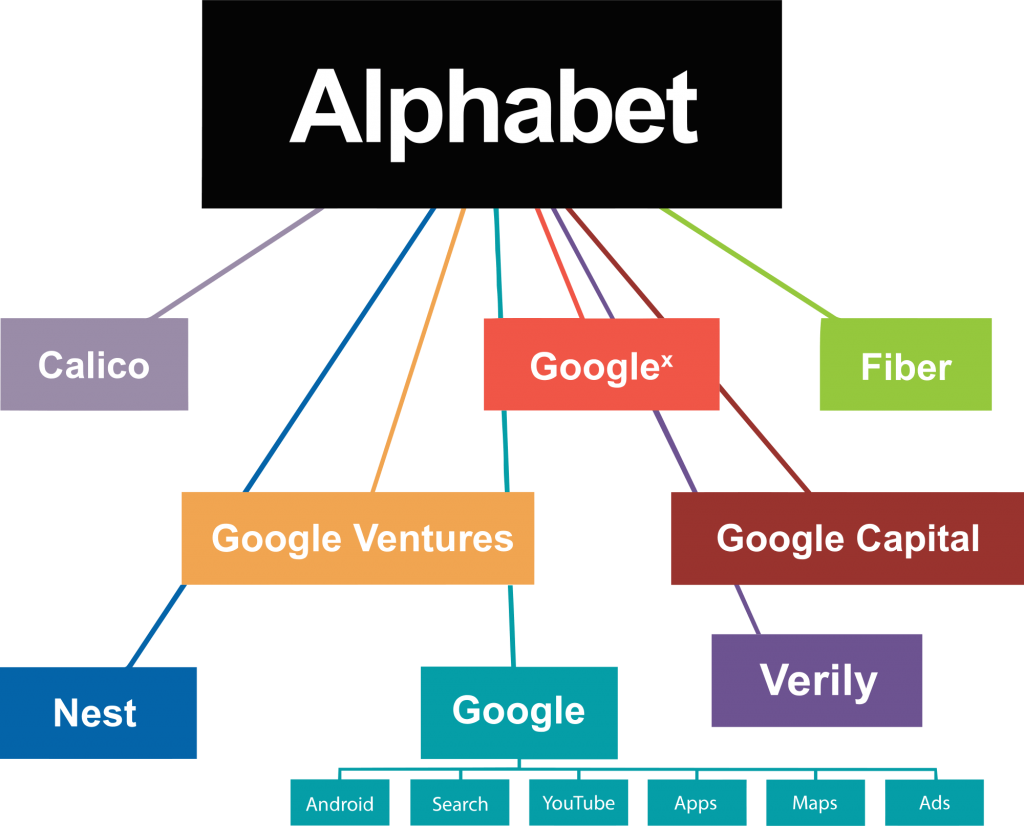
Google is among the most valuable brands in the world. Google is well known for its Search, Youtube, Gmail, Chrome browser, and Android products. Advertisers can target online users with Google products such as Adwords, Adsense, and DoubleClick Ad Exchange. Google makes most of its money from advertisers.

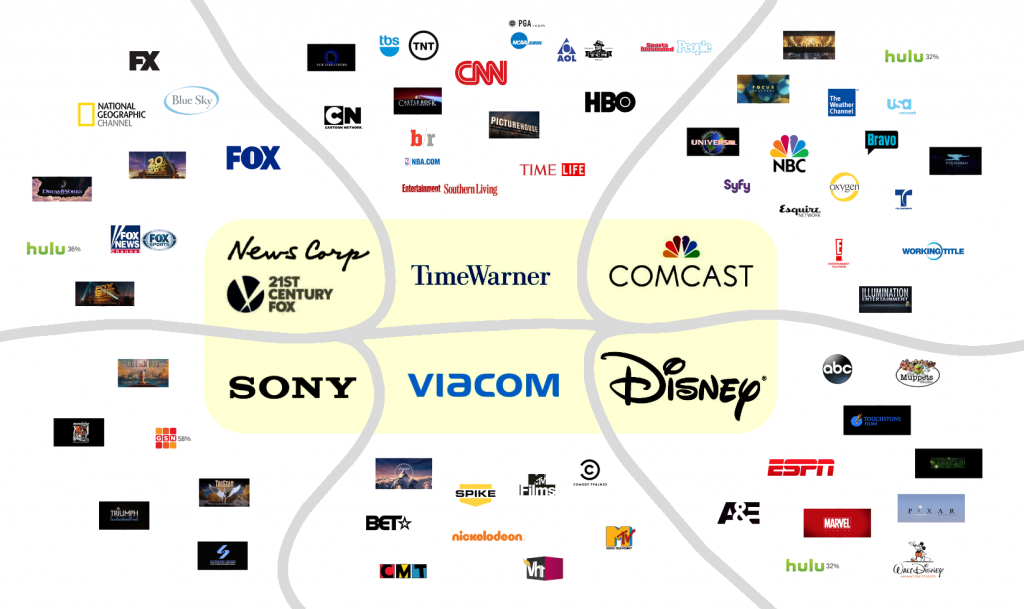
Just to show you how dominant Google’s position in the advertising world, we compared Google advertising revenues with those of US top-10 media companies. The US top-10 media companies we analyzed are: Comcast Corporation, The Walt Disney Company, Twenty-First Century Fox, CBS Corporation, Viacom, Time Warner, News Corporation, Discovery Communications, Scripps Networks Interactive, and Gannett Co.
Google earned more revenue from advertising than the combined advertising revenue of top-10 media companies in US
Google generated $67,390 million of revenues from advertising in 2015. On the other hands, the combined advertising revenues of US top-10 media companies were $54,715 million.
Google not only generates much more advertising revenues than the top media companies, but also is growing much faster than them. During 2015, Google revenues increased 13.0% year-on-year from $59,624 million in 2014 to $67,390 million in 2015. On the other hands, the combined advertising revenues of top-10 media companies declined -1.4% year-on-year from $55,510 million in 2014 to $54,710 million in 2015.
Google’s faster growth in advertising revenue is resulting in increased advertising revenue share as well. Google advertising revenue share increased from 48.6% in 2013 to 55.2% in 2015. (Google advertising revenue share is calculated by first adding Google advertising revenues and US top-10 media companies advertising revenues and then dividing Google advertising revenue with the total revenues from the first step.)
Clearly, Google holds a dominant position in the world of advertising. Has Google become invincible? Can traditional media industry make a comeback now? How the revenue share will look like in the next 5-10 years?
Google Advertising Revenue 2015
During FY 2015 (fiscal year ending December 31, 2015), Alphabet (parent company of Google) generated a total of $74,989 million of revenues. Of these, Alphabet generated $74,541 million of revenues from Google segment and $448 million from ‘Other Bets’. Of the Google segment total revenues of $74,541 million, Google generated $67,390 million of revenues from advertising.
Comcast Advertising Revenue 2015
During FY 2015 (fiscal year ending December 31, 2015), Comcast Corporation generated a total of $74,510 million of revenues. Of these, Comcast generated $46,879 million of revenues from Cable Communications segment and $28,462 million of revenues from NBC Universal segment.
- Comcast’s cable communications segment generated $2,318 million revenues from advertising.
- NBC Universal’s cable network segment generated $3,435 million of revenues from advertising.
- NBC Universal’s broadcast television segment generated $5,747 million of revenues from advertising.
In total, Comcast generated $11,500 million of revenues from advertising.
Disney Advertising Revenue 2015
During FY 2015 (fiscal year ending October 3, 2015), The Walt Disney Company generated a total of $52,465 million of revenues. Of these, Disney generated $8,499 million of revenues from advertising. (Please see ‘How Disney Makes Money’ to see more details about different business segments of Disney).

Twenty-First Century Fox Advertising Revenue 2015
During FY 2015 (fiscal year ending June 30, 2015), Twenty-First Century Fox generated a total of $28,987 million of revenues. Of these, the company generated $7,609 million of revenues from advertising.
CBS Corporation Advertising Revenue 2015
During FY 2015 (fiscal year ending December 31, 2015), CBS Corporation generated a total of $13,886 million of revenues. Of these, the company generated $7,018 million of revenues from advertising.
Viacom Advertising Revenue 2015
During FY 2015 (fiscal year ending September 30, 2015), Viacom generated a total of $13,268 million of revenues. Of these, the company generated $5,007 million of revenues from advertising.
Time Warner Advertising Revenue 2015
During FY 2015 (fiscal year ending December 31, 2015), Time Warner generated a total of $28,118 million of revenues. Of these, the company generated $4,569 million of revenues from advertising.
News Corp Advertising Revenue 2015
During FY 2015 (fiscal year ending June 30, 2015), News Corporation generated a total of $8,633 million of revenues. Of these, the company generated $3,835 million of revenues from advertising.
Discovery Communications Advertising Revenue 2015
During FY 2015 (fiscal year ending December 31, 2015), Discovery Communications generated a total of $6,394 million of revenues. Of these, the company generated $3,004 million of revenues from advertising.

Scripps Networks Advertising Revenue 2015
During FY 2015 (fiscal year ending December 31, 2015), Scripps Networks Interactive generated a total of $3,018 million of revenues. Of these, the company generated $2,063 million of revenues from advertising.
Gannett Advertising Revenue 2015
During FY 2015 (fiscal year ending December 27, 2015), Gannett Co. generated a total of $2,885 million of revenues. Of these, the company generated $1,611 million of revenues from advertising.
Notes
- Fiscal year for few companies in the charts above does not end in December. Disney and Viacom fiscal year ends in September. News corp and Twenty-first Century Fox fiscal year ends in June. Ideally, we should take quarterly numbers of these companies and add them up to calculate the calendar year numbers. The fiscal year numbers are chosen for analysis because they are readily available and most people can easily relate to these numbers. Since the purpose of this article is to provide the big picture, making adjustments for one or two quarter of revenues of these companies won’t impact the overall message.
- Only public companies are considered in the above analysis. The private companies are not considered because their advertising revenues are not available from confirmed sources.
- The source of all the revenue related data are the companies latest available annual reports.


