
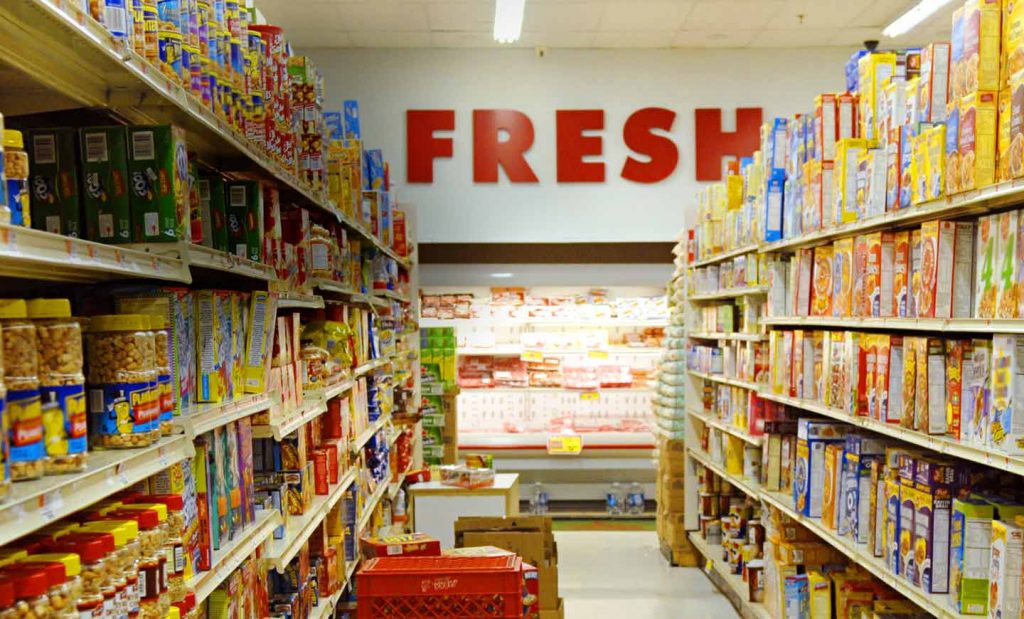
Hormel Foods Corporation produces and markets various meat and food products worldwide. The company operates in five segments: Grocery Products, Refrigerated Foods, Jennie-O Turkey Store, Specialty Foods, and International & Other. It provides various perishable meat products, including fresh meats, frozen items, refrigerated meal solutions, sausages, hams, guacamole, and bacon; and shelf-stable products comprising canned luncheon meats, shelf-stable microwaveable meals, stews, chilies, hash, flour and corn tortillas, salsas, tortilla chips, peanut butter, and other products. The company also offers poultry products, such as turkey products; and nutritional food products and supplements, sugar and sugar substitutes, dessert and drink mixes, and industrial gelatin products. It sells its products through sales personnel, as well as through independent brokers and distributors. The company was formerly known as Geo. A. Hormel & Company and changed its name to Hormel Foods Corporation in January 1995. Hormel Foods Corporation was founded in 1891 and is headquartered in Austin, Minnesota.
BUSINESS ANALYSIS OF HORMEL FOODS
The Consumer Goods Sector is witnessing a major shakeup, new age business models in the industry are transforming both customers and businesses. Faced with this uncertainity, companies are investing resources to transform their business. An in-depth business analysis is a valuable resource to identify and articulate the need for a business model change. At R&P Research we believe, the starting point for a business analysis is Benchmarking. Business benchmarking can be done at various levels: 1) Industry Benchmarking 2) Peer Benchmarking 3) Disruptors Benchmarking. In this report, we share the snapshot of how Hormel Foods compares against the industry on the major performance indicators. This analysis, along with peer group/disruptors benchmarking and revenue model understanding can help identify growth and cost optimization opportunities to maximize the value delivered by Hormel Foods to its stakeholders. R&P Research Industry Intelligence Platform provides historical data for last 15 years with an easy to use benchmarking interface for an in-depth comparative business analysis.
Here is the performance snapshot of Hormel Foods with an interactive chart.
- Revenue Growth: Hormel Foods reported a revenue growth of 2.8% year-on-year during 2016. Diversified Food Industry grew at 12.9% in the same period
- COGS share of Revenues: As a percentage of revenue, Hormel Foods spent 77.3% of its total revenues on COGS. Diversified Food industry average (COGS share of revenue) in the same period was 67.8%
- R&D; share of Revenues: Hormel Foods R&D; share of Revenues details are not available because either company does not share the data or we do not have it
- SG&A; share of Revenues: As a percentage of revenue, Hormel Foods spent 9.2% of its total revenues on Sales, Marketing, and General Administration (SG&A;). Diversified Food industry average SG&A; spending in the same period was 16.7%
- Inventory share of Revenues: As a percentage of revenue, Hormel Foods spent 10.4% of its total revenues on Inventories. Diversified Food industry average Inventory spending in the same period was 10.3%
- Accounts Payable share of Revenues: As a percentage of revenue, Hormel Foods invested 5.9% of its total revenues on Accounts Payable (A/P) Diversified Food industry average Accounts Payable investment in the same period was 10.9%
- Accounts Receivable share of Revenues: As a percentage of revenue, Hormel Foods invested 6.2% of its total revenues on Accounts Receivable (A/R). Diversified Food industry average Accounts Receivable investment in the same period was 6.4%
- PP&E; share of Revenues: As a percentage of revenue, Hormel Foods invested 11.6% of its total revenues on Property, Plants, and Equipments (PP&E;). Diversified Food industry average PPE investment in the same period was 22.8%
- Intangibles share of Revenues: As a percentage of revenue, Hormel Foods invested 28.7% of its total revenues on Intangibles. Diversified Food industry average Intangibles investment in the same period was 139.8%
- Net Margins: Hormel Foods Net Margins in the year 2016 were 9.3%. Diversified Food industry average Net Margins in the same period were 7.0%

SECTOR AND INDUSTRY ASSOCIATION OF HORMEL FOODS
For the purpose of performance benchmarking of a company with a sector or industry average, R&P; Research associates every company with one sector and one industry. An industry consists of companies with related/similar business models. A sector comprises of a group of related/similar industries.
Hormel Foods is associated with Consumer Goods Sector and Diversified Food Industry.
Consumer Goods sector is comprised of the following industries: Beverages; Personal Goods; Food Products; Diversified Food; Household Goods & Home Construction; Food Distribution; Toys and Games. The definitions for each of the industries is as follows:
- Beverages industry consists of: Brewing Companies – manufacturers of cider or malt products such as beer, ale and stout; Distillers and Vintners Companies – blenders and shippers of wine and spirits such as whisky, brandy, rum, gin or liqueurs; and Soft Drinks Companies – manufacturers, bottlers and distributors of nonalc*holic beverages, such as soda, fruit juices, tea, coffee and bottled water.
- Personal Goods industry includes: Clothing & Accessories Companies – manufacturers and distributors of all types of clothing, jewellery, watches or textiles, sportswear, sunglasses, eyeglass frames, leather clothing and goods, and processors of hides and skins; Footwear Companies – manufacturers and distributors of shoes, boots, sandals, sneakers and other types of footwear; and Consumer Packaged Goods Companies – makers and distributors of cosmetics, toiletries and personal-care and hygiene products, including deodorants, soaps, toothpaste, perfumes, diapers, shampoos, razors and feminine hygiene products.
- Food Products industry includes: Farming & Fishing companies – companies that grow crops or raise livestock; Food Products Companies – food producers, including meatpacking, snacks, fruits, vegetables, dairy products and frozen seafood. It also includes producers of pet food and manufacturers of dietary supplements, vitamins and related items.
- Diversified Food industry includes companies that offer a diverse portfolio of food products across agricultural, animal and dairy product categories.
- Household Goods & Home Construction industry includes companies that offer: Durable Household Products – Manufacturers and distributors of domestic appliances, lighting, hand tools and power tools, hardware, cutlery, tableware, garden equipment, luggage, towels and linens; Nondurable Household Products – Producers and distributors of pens, paper goods, batteries, light bulbs, tissues, toilet paper and cleaning products such as soaps and polishes; Furnishings – Manufacturers and distributors of furniture, including chairs, tables, desks, carpeting, wallpaper and office furniture; Home Construction – constructors of residential homes, including manufacturers of mobile and prefabricated homes intended for use in one place.
- Food Distribution industry includes companies that distribute food, beverage and consumer goods to restaurants, healthcare, educational facilities, lodging establishments; equipment and supplies for the foodservice and hospitality industries.
- Toys and Games industry consists of manufacturers and distributors of toys and video/computer games, including such toys and games as playing cards, board games, stuffed animals and dolls.
INDUSTRY RANKING OF HORMEL FOODS
With $9.5 billion revenues, Hormel Foods ranked number 5 of all the companies in the US Diversified Food industry. There were a total of 18 public companies in the US Diversified Food industry that had revenues greater than $50 million during 2016.
The top-10 companies in the US Diversified Food industry by revenues during 2016 were:
- Kraft Heinz ($26.5 billion)
- General Mills ($16.6 billion)
- Kellogg ($13 billion)
- Conagra ($11.6 billion)
- Hormel Foods ($9.5 billion)
- Campbell Soup Company ($8 billion)
- Smuckers ($7.8 billion)
- TreeHouse Foods ($6.2 billion)
- Post Holdings ($5 billion)
- WhiteWave Foods ($4.2 billion)

BUSINESS MODEL ANALYSIS (BMA) FRAMEWORK
We use the following framework to assess the business model of a company. Business Model Analysis framework can be used by organizations to articulate growth strategies and identify cost optimization opportunities. Technology and consulting companies can use this framework to identify the value drivers and pain points of their targeted customers. Entrepreneurs can use this framework to understand the language of business and identify promising business opportunities. This framework can be used by any professional aspiring to take up a leadership role to better understand the businesses challenges, articulate growth strategy, and monitor the business improvement requirements for the organization.
INDUSTRY PEERS AND COMPETITORS OF HORMEL-FOODS

General Mills (GIS) Business Analysis – Analyze Historical Performance, Strategic Priorities,…
General Mills Inc with $17 billion revenues in the year 2016 was the number 2 Diversified Food company. Read this report to know the top competitors of General Mills and identify growth and cost optimization opportunities of General Mills
Kellogg (K) Business Analysis – Analyze Historical Performance, Strategic Priorities, And…
Kellogg Co with $13 billion revenues in the year 2016 was the number 3 Diversified Food company. Read this report to know the top competitors of Kellogg and identify growth and cost optimization opportunities of Kellogg
Conagra (CAG) Business Analysis – Analyze Historical Performance, Strategic Priorities, And…
Conagra Brands Inc. with $12 billion revenues in the year 2016 was the number 4 Diversified Food company. Read this report to know the top competitors of Conagra and identify growth and cost optimization opportunities of Conagra
Campbell Soup Company (CPB) Business Analysis – Analyze Historical Performance, Strategic…
Campbell Soup Company with $8 billion revenues in the year 2016 was the number 6 Diversified Food company. Read this report to know the top competitors of Campbell Soup Company and identify growth and cost optimization opportunities of Campbell Soup Company
Smuckers (SJM) Business Analysis – Analyze Historical Performance, Strategic Priorities, And…
J. M. Smucker Company with $8 billion revenues in the year 2016 was the number 7 Diversified Food company. Read this report to know the top competitors of Smuckers and identify growth and cost optimization opportunities of Smuckers
TreeHouse Foods (THS) Business Analysis – Analyze Historical Performance, Strategic Priorities,…
TreeHouse Foods, Inc. with $6 billion revenues in the year 2016 was the number 8 Diversified Food company. Read this report to know the top competitors of TreeHouse Foods and identify growth and cost optimization opportunities of TreeHouse Foods
REVENUES ANALYSIS

Hormel Foods (HRL) Revenues And Revenue Growth From 2012 To 2016
This report provides the last five years revenues and revenue growth of Hormel Foods Corp (HRL) from 2012 to 2016. Hormel Foods generated a total of $9.5 billion revenues during 2016. Hormel Foods reported a revenue growth of 2.8% year-over-year during 2016. The revenues and the revenue growth correspond to the fiscal year ending in October.
Hormel Foods (HRL) Revenues And Revenue Growth From 2002 To 2016
This report provides the last fifteen years revenues and revenue growth of Hormel Foods Corp (HRL) from 2002 to 2016. Hormel Foods generated a total of $9.5 billion revenues during 2016. Hormel Foods reported a revenue growth of 2.8% year-over-year during 2016. The revenues and the revenue growth correspond to the fiscal year ending in October.
Hormel Foods (HRL) Revenue Growth Comparison With Industry Growth From 2012…
This report provides a comparison of Hormel Foods Corp (HRL) revenue growth with Diversified Food industry growth during the last five years from 2012 to 2016. Hormel Foods reported a revenue growth of 2.8% year-over-year during 2016. The Diversified Food industry growth was 12.9% year-over-year during 2016. Hormel Foods growth was slower than the industry during 2016.
PROFIT ANALYSIS

Hormel Foods (HRL) Net Profit And Net Margin From 2012 To…
This report provides the last five years net profit and net margin of Hormel Foods Corp (HRL) from 2012 to 2016. Hormel Foods reported a total net income of $890.1 million during 2016. Hormel Foods generated a total of $9.5 billion revenues during 2016. Hormel Foods net profit margin was 9.3% during 2016. The net profit and the net profit margin correspond to the fiscal year ending in October.
Hormel Foods (HRL) Net Profit And Net Margin From 2002 To…
This report provides the last fifteen years net profit and net margin of Hormel Foods Corp (HRL) from 2002 to 2016. Hormel Foods reported a total net income of $890.1 million during 2016. Hormel Foods generated a total of $9.5 billion revenues during 2016. Hormel Foods net profit margin was 9.3% during 2016. The net profit and the net profit margin correspond to the fiscal year ending in October.
Hormel Foods (HRL) Net Profit Margin Comparison With Industry From 2012…
This report provides a comparison of Hormel Foods Corp (HRL) net profit margin with Diversified Food industry net profit margin during the last five years from 2012 to 2016. Hormel Foods reported a net profit margin of 9.3% during 2016. The Diversified Food industry net profit margin was 7% during 2016. Hormel Foods was more profitable than the industry during 2016.
COST EXPENSES ANALYSIS

Hormel Foods (HRL) Cost of Sales (COGS) Analysis From 2012 To…
This report provides the last five years cost of sales (COGS) analysis of Hormel Foods Corp (HRL) from 2012 to 2016. Hormel Foods spent a total of $7.4 billion on COGS during 2016. Hormel Foods generated a total of $9.5 billion revenues during 2016. As a percentage of revenues, Hormel Foods spent 77.3% of its total revenues on COGS during 2016. The cost of sales (COGS) numbers are for the fiscal year ending in October.
Hormel Foods (HRL) Research & Development (R&D) Spending Analysis 2016
R&D; spending analysis for Hormel Foods is not available because either the company does not provide the data or we don’t have it.
Hormel Foods (HRL) Sales, Marketing, General & Administrative (SG&A) Spending Analysis…
This report provides the last five years sales, marketing, general & administrative (SG&A;) expenses of Hormel Foods Corp (HRL) from 2012 to 2016. Hormel Foods spent a total of $872 million on sales, marketing, general, and administrative (SG&A;) activities during 2016. Hormel Foods generated a total of $9.5 billion revenues during 2016. As a percentage of revenues, Hormel Foods spent 9.2% of its total revenues on SG&A; activities during 2016. The SG&A; spending numbers are for the fiscal year ending in October.
WORKING CAPITAL ANALYSIS

Hormel Foods (HRL) Inventory Spending Analysis From 2012 To 2016
This report provides the last five years inventory spending analysis of Hormel Foods Corp (HRL) from 2012 to 2016. Hormel Foods invested a total of $985.7 million on inventories during 2016. Hormel Foods generated a total of $9.5 billion revenues during 2016. As a percentage of revenues, Hormel Foods invested 10.4% of its total revenues on inventories during 2016. The inventory numbers are for the fiscal year ending in October.
Hormel Foods (HRL) Accounts Receivable (A/R) Analysis From 2012 To 2016
This report provides the last five years Accounts Receivable (A/R) analysis of Hormel Foods Corp (HRL) from 2012 to 2016. Hormel Foods invested a total of $591.3 million on accounts receivable during 2016. Hormel Foods generated a total of $9.5 billion revenues during 2016. As a percentage of revenues, Hormel Foods invested 6.2% of its total revenues on accounts receivable during 2016. The accounts receivable numbers are for the fiscal year ending in October.
Hormel Foods (HRL) Accounts Payable (A/P) Analysis From 2012 To 2016
This report provides the last five years Accounts Payable (A/P) analysis of Hormel Foods Corp (HRL) from 2012 to 2016. Hormel Foods invested a total of $559.1 million on accounts payable during 2016. Hormel Foods generated a total of $9.5 billion revenues during 2016. As a percentage of revenues, Hormel Foods invested 5.9% of its total revenues on accounts payable activities during 2016. The accounts payable numbers are for the fiscal year ending in October.
ASSET MANAGEMENT ANALYSIS

Hormel Foods (HRL) Property, Plant & Equipment (PP&E) Investment Analysis From…
This report provides the last five years property, plant & equipment (PP&E;) investment analysis of Hormel Foods Corp (HRL) from 2012 to 2016. Hormel Foods invested a total of $1.1 billion on property, plant & equipment (PP&E;) activities during 2016. Hormel Foods generated a total of $9.5 billion revenues during 2016. As a percentage of revenues, Hormel Foods invested 11.6% of its total revenues on PP&E; activities during 2016. The PP&E; investment numbers are for the fiscal year ending in October.
Hormel Foods (HRL) Intangible Assets Analysis From 2012 To 2016
This report provides the last five years Intangible assets analysis of Hormel Foods Corp (HRL) from 2012 to 2016. Hormel Foods invested a total of $2.7 billion on Intangible assets during 2016. Hormel Foods generated a total of $9.5 billion revenues during 2016. As a percentage of revenues, Hormel Foods invested 28.7% of its total revenues on intangible assets during 2016. The Intangible asset numbers are for the fiscal year ending in October.


