
This report provides the last five years revenues and revenue growth of Macy’s, Inc. (M) from 2012 to 2016. Macy’s generated a total of $27.1 billion revenues during 2016. Macy’s reported a revenue growth of -3.7% year-over-year during 2016. The revenues and the revenue growth correspond to the fiscal year ending in January.
MACY’S REVENUES FROM 2012 TO 2016

Here are the revenues and the revenue growth details of Macy’s during the last five years:
- Macy’s generated a total of $26.4 billion revenues during 2012. Macy’s reported a revenue growth of 5.6% year-over-year during 2012.
- Macy’s generated a total of $27.7 billion revenues during 2013. Macy’s reported a revenue growth of 4.9% year-over-year during 2013.
- Macy’s generated a total of $27.9 billion revenues during 2014. Macy’s reported a revenue growth of 0.9% year-over-year during 2014.
- Macy’s generated a total of $28.1 billion revenues during 2015. Macy’s reported a revenue growth of 0.6% year-over-year during 2015.
- Macy’s generated a total of $27.1 billion revenues during 2016. Macy’s reported a revenue growth of -3.7% year-over-year during 2016.
WHY ANALYZE REVENUE GROWTH?
Revenue growth is the most commonly analyzed financial metric. Revenue Growth is the percent increase (or decrease) of a company’s revenue between two time periods. It is computed by using the following formula: ((revenues during the time period two – revenues during the time period one) / revenues during the time period one)*100. If the time periods are two consecutive years, then the revenue growth is referred to as the annual revenue growth year-over-year. If the time periods are two consecutive quarters, then the revenue growth is referred to as the quarterly revenue growth quarter-over-quarter. If the time periods refer to the same quarter in the two consecutive years, then the revenue growth is referred to as quarterly revenue growth year-over-year. In case the time periods are two non-consecutive years, then the revenue CAGR (Commutative Annual Growth Rate) is computed.
Revenue growth analysis is important for a number of reasons. First, it helps in understanding how a business is performing. If the revenue growth rates are positive, it means the business is performing well and the revenues are increasing. If the revenue growth rates are negative, it means the revenues are declining and the company needs to take measures to increase them. If they don’t, the company will continue to shrink. Second, a company’s historical revenue growth analysis along with the market size and market share analysis helps in forecasting the future revenues of a company. Third, a comparison of a company’s growth rates with its competitors helps in determining who is winning more business. A revenue growth higher than the industry average translates into increasing market share. Companies with very high revenue growth rates have the potential to be the industry disrupters.
MACY’S RANKING
With $27.1 billion revenues, Macy’s ranked number 98 in the R&P; Research list of top-3000 public companies in the US by revenues during 2016. Each one of the top-3000 companies generated more than $50 million of annual revenues during 2016.
The top-20 companies in the US by revenues during 2016 were:
- Walmart ($482.1 billion)
- ExxonMobil ($226.1 billion)
- Berkshire Hathaway ($223.6 billion)
- Apple ($215.6 billion)
- McKesson ($190.9 billion)
- UnitedHealth Group ($184.8 billion)
- CVS Health ($177.5 billion)
- General Motors ($166.4 billion)
- AT&T; ($163.8 billion)
- Ford Motor ($151.8 billion)
- AmerisourceBergen ($146.8 billion)
- Amazon ($136 billion)
- Verizon ($126 billion)
- General Electric ($123.7 billion)
- Cardinal Health ($121.5 billion)
- Costco ($118.7 billion)
- Walgreens Boots Alliance ($117.4 billion)
- Chevron ($114.5 billion)
- Kroger ($109.8 billion)
- Express Scripts Holding ($100.3 billion)
For the purpose of performance benchmarking of a company with a sector or industry average, R&P; Research associates every company with one sector and one industry. An industry consists of companies with related/similar business models. A sector comprises of a group of related/similar industries. For example, Life Sciences sector is comprised of following industries: Pharmaceuticals; Medical Devices; Biotechnology; Diagnostics & Scientific Instruments.
Macy’s is associated with Retail Sector and Broadline Retail Industry.
With $27.1 billion revenues, Macy’s ranked number 9 of all the companies in the US Retail sector. There were a total of 163 public companies in the US Retail sector that had revenues greater than $50 million during 2016.

The top-10 companies in the US Retail sector by revenues during 2016 were:
- Walmart ($482.1 billion)
- Costco ($118.7 billion)
- Kroger ($109.8 billion)
- Home Depot ($88.5 billion)
- Target ($73.8 billion)
- Lowe’s ($59.1 billion)
- Best Buy ($39.5 billion)
- TJX Companies ($30.9 billion)
- Macy’s ($27.1 billion)
- Sears Holdings ($25.1 billion)
Retail sector is comprised of the following industries: Broadline Retail; Grocery Retail; Specialty Retail; Apparel Retail; Home Improvement Retail; Specialized Consumer Services. The definitions for each of the industries is as follows:
- Broadline Retail industry includes retail outlets and wholesalers offering a wide variety of products including both hard goods and soft goods.
- Grocery Retail industry includes retail stores that primarily offer non-perishable food that is packaged in cans, bottles and boxes, with some also having fresh produce, butchers, delis, and bakeries

- Specialty Retail industry includes retailers and wholesalers concentrating on a Single Class of Goods, such as electronics, books, automotive parts or closeouts. It also includes automobile dealerships, video rental stores, dollar stores, duty-free shops and automotive fuel stations not owned by oil companies.
- Apparel Retail industry consists of retailers and wholesalers specializing mainly in Clothing, Shoes, Jewelry, Sunglasses and Other accessories.
- Home Improvement Retail industry includes retailers and wholesalers concentrating on the sale of home improvement products, including Garden Equipment, Carpets, Wallpaper, Paint, Home Furniture, Blinds and Curtains, and Building materials.
- Specialized Consumer Services industry includes providers of consumer services such as Auction Houses, Day-care Centers, Dry Cleaners, Schools, Consumer Rental Companies, Veterinary Clinics, Hair Salons and providers of Funeral, Lawn-maintenance, Consumer-storage, Heating and Cooling installation and Plumbing services.

With $27.1 billion revenues, Macy’s ranked number 4 of all the companies in the US Broadline Retail industry. There were a total of 21 public companies in the US Broadline Retail industry that had revenues greater than $50 million during 2016.
The top-10 companies in the US Broadline Retail industry by revenues during 2016 were:

- Walmart ($482.1 billion)
- Costco ($118.7 billion)
- Target ($73.8 billion)
- Macy’s ($27.1 billion)
- Sears Holdings ($25.1 billion)
- Dollar General ($20.4 billion)
- Kohl’s ($19.2 billion)
- Dollar Tree ($15.5 billion)
- J. C. Penney ($12.6 billion)
- Dillard’s ($6.8 billion)
COMPANIES SEGMENTATION
To identify and analyze high/low growth or most/least profitable similar-size companies in different sectors or industries, R&P; research classifies all companies into different segments based upon their revenues, revenue growth, and net profit margins.
Based upon their annual revenues, the companies are classified into one of the following four segments:
- Mega companies, having revenues greater than $50 billion.
- Very Large companies, having revenues between $10 billion and $50 billion.
- Large companies, having revenues between $1 billion and $10 billion.
- Mid-size companies, having revenues between $50 million and $1 billion.
With $27.1 billion revenues, Macy’s was in the Very Large companies revenue segment during 2016. There were a total of 239 companies in the Very Large companies revenue segment during 2016.
Based upon their annual revenue growth, the companies are classified into one of the following eight segments:
- Very High positive growth companies, having annual revenue growth greater than 50%.
- High positive growth companies, having annual revenue growth between 20% and 50%.
- Medium positive growth companies, having annual revenue growth between 5% and 20%.
- Low positive growth companies, having annual revenue growth between 0% and 5%.
- Low negative growth companies, having annual revenue growth between -5% and 0%.
- Medium negative growth companies, having annual revenue growth between -20% and -5%.
- High negative growth companies, having annual revenue growth between -50% and -20%.
- Very High negative growth companies, having annual revenue growth less than -50%.
With -3.7% revenue growth year-over-year, Macy’s was in the Low negative revenue growth segment during 2016. There were a total of 384 companies in the Low negative revenue growth segment during 2016. Of the US top-3000 companies, 1985 (nearly two-third of the total) had positive revenue growth and 1015 (nearly one-third of the total) had negative revenue growth during 2016.
Based upon their annual net profit margin, the companies are classified into one of the following eight segments:
- Very High positive margin companies, having net profit margin greater than 50%.
- High positive margin companies, having net profit margin between 20% and 50%.
- Medium positive margin companies, having net profit margin between 5% and 20%.
- Low positive margin companies, having net profit margin between 0% and 5%.
- Low negative margin companies, having net profit margin between -5% and 0%.
- Medium negative margin companies, having net profit margin between -20% and -5%.
- High negative margin companies, having net profit margin between -50% and -20%.
- Very High negative margin companies, having net profit margin less than -50%.
With a net margin of 4%, Macy’s was in the Low positive net profit margin segment during 2016. There were a total of 707 companies in the Low positive net profit margin segment during 2016. Of the US top-3000 companies, 2244 (nearly three-fourth of the total) had positive net profit margin and 756 (nearly one-fourth of the total) had negative net profit margin during 2016.
COMPANY BUSINESS SUMMARY
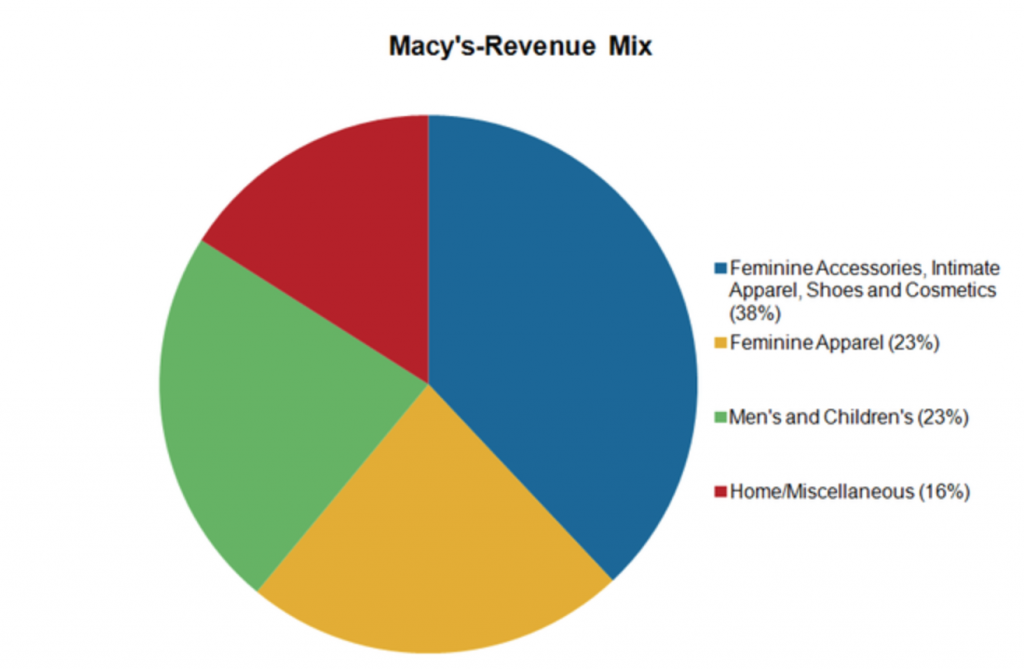
Macy’s, Inc., together with its subsidiaries, operates stores, Websites, and mobile applications. Its stores and Websites sell a range of merchandise, including apparel and accessories for men, women, and children; cosmetics; home furnishings; and other consumer goods. The company also operates stores that offer a range of women’s, men’s, and children’s apparel; shoes; fashion accessories; housewares; home textiles; intimate apparel; and jewelry. As of August 21, 2017, it operated approximately 700 department stores under the Macy’s and Bloomingdale’s brands; 150 specialty stores under the Bloomingdale’s, The Outlet, Bluemercury, and Macy’s Backstage brands in the United States, the District of Columbia, Guam, and Puerto Rico; and Websites, including macys.com, bloomingdales.com, and bluemercury.com. In addition, it operates as a beauty products and spa retailer. The company was formerly known as Federated Department Stores, Inc. and changed its name to Macy’s, Inc. in June 2007. Macy’s, Inc. was founded in 1830 and is based in Cincinnati, Ohio.


