The Progressive Corporation, through its subsidiaries, provides personal and commercial property-casualty insurance and other specialty property-casualty insurance and related services primarily in the United States. Its Personal Lines segment writes insurance for personal autos, and recreational and other vehicles. This segment’s products include personal auto insurance; and special lines products, including insurance for motorcycles, ATVs, RVs, mobile homes, watercraft, and snowmobiles. The company’s Commercial Lines segment provides primary liability, physical damage, and other auto-related insurance for autos, vans, and pick-up trucks, and dump trucks used by small businesses; tractors, trailers, and straight trucks primarily used by regional general freight and expeditor-type businesses, and non-fleet long-haul operators; dump trucks, log trucks, and garbage trucks used by dirt, sand and gravel, logging, and coal-type businesses; tow trucks and wreckers used in towing services and gas/service station businesses; and non-fleet taxis, black-car services, and airport taxis. Its Property segment provides residential property insurance for homeowners, other property owners, and renters, as well as offers personal umbrella insurance, and primary and excess flood insurance. The company also offers policy issuance and claims adjusting services; home, condominium, renters, and other insurance; and general liability and business owners policies, and workers’ compensation insurance, as well as sells personal auto physical damage and auto property damage liability insurance in Australia. In addition, it offers reinsurance services. The Progressive Corporation sells its products and services through independent insurance agencies, as well as directly on Internet, and mobile devices, and over the phone. The company was founded in 1937 and is headquartered in Mayfield Village, Ohio.

BUSINESS ANALYSIS OF PROGRESSIVE
The Insurance Sector is witnessing a major shakeup, new age business models in the industry are transforming both customers and businesses. Faced with this uncertainity, companies are investing resources to transform their business. An in-depth business analysis is a valuable resource to identify and articulate the need for a business model change. At R&P Research we believe, the starting point for a business analysis is Benchmarking. Business benchmarking can be done at various levels: 1) Industry Benchmarking 2) Peer Benchmarking 3) Disruptors Benchmarking. In this report, we share the snapshot of how Progressive compares against the industry on the major performance indicators. This analysis, along with peer group/disruptors benchmarking and revenue model understanding can help identify growth and cost optimization opportunities to maximize the value delivered by Progressive to its stakeholders. R&P Research Industry Intelligence Platform provides historical data for last 15 years with an easy to use benchmarking interface for an in-depth comparative business analysis.
- Revenue Growth: Progressive reported a revenue growth of 12.4% year-on-year during 2016. Property & Casualty Insurance Industry grew at 6.6% in the same period
- COGS share of Revenues: As a percentage of revenue, Progressive spent 72.0% of its total revenues on COGS. Property & Casualty Insurance industry average (COGS share of revenue) in the same period was 65.6%
- R&D; share of Revenues: Progressive R&D; share of Revenues details are not available because either company does not share the data or we do not have it
- SG&A; share of Revenues: As a percentage of revenue, Progressive spent 20.6% of its total revenues on Sales, Marketing, and General Administration (SG&A;). Property & Casualty Insurance industry average SG&A; spending in the same period was 14.9%
- Inventory share of Revenues: Progressive Inventory share of Revenues details are not available because either company does not share the data or we do not have it
- Accounts Payable share of Revenues: As a percentage of revenue, Progressive invested 12.3% of its total revenues on Accounts Payable (A/P) Property & Casualty Insurance industry average Accounts Payable investment in the same period was 18.9%
- Accounts Receivable share of Revenues: As a percentage of revenue, Progressive invested 20.0% of its total revenues on Accounts Receivable (A/R). Property & Casualty Insurance industry average Accounts Receivable investment in the same period was 33.0%
- PP&E; share of Revenues: As a percentage of revenue, Progressive invested 5.0% of its total revenues on Property, Plants, and Equipments (PP&E;). Property & Casualty Insurance industry average PPE investment in the same period was 30.9%
- Intangibles share of Revenues: As a percentage of revenue, Progressive invested 3.8% of its total revenues on Intangibles. Property & Casualty Insurance industry average Intangibles investment in the same period was 29.7%
- Net Margins: Progressive Net Margins in the year 2016 were 4.4%. Property & Casualty Insurance industry average Net Margins in the same period were 8.2%

SECTOR AND INDUSTRY ASSOCIATION OF PROGRESSIVE
For the purpose of performance benchmarking of a company with a sector or industry average, R&P; Research associates every company with one sector and one industry. An industry consists of companies with related/similar business models. A sector comprises of a group of related/similar industries. For high-level analysis purposes, related/similar sectors are grouped into sector groups.
Progressive is associated with Financials Sector Group, Insurance Sector and Property & Casualty Insurance Industry.
Insurance sector is comprised of the following industries: Life Insurance; Property & Casualty Insurance; Surety & Title Insurance; Insurance Brokerage; Diversified Insurance. The definitions for each of the industries is as follows:
- Life Insurance industry includes companies engaged principally in life insurance.
- Property & Casualty Insurance industry includes companies engaged principally in accident, fire, automotive, marine, malpractice and other classes of non-life insurance.
- Surety & Title Insurance industry includes companies providing title & surety insurance.
- Insurance Brokerage industry includes insurance brokers and agencies.
- Diversified Insurance industry includes companies with life, health, property & casualty, and reinsurance interests, none of which predominates.
INDUSTRY RANKING OF PROGRESSIVE
With $23.4 billion revenues, Progressive ranked number 6 of all the companies in the US Property & Casualty Insurance industry. There were a total of 66 public companies in the US Property & Casualty Insurance industry that had revenues greater than $50 million during 2016.
The top-10 companies in the US Property & Casualty Insurance industry by revenues during 2016 were:
- Berkshire Hathaway ($223.6 billion)
- AIG ($52.4 billion)
- Allstate ($36.5 billion)
- Chubb ($31.5 billion)
- Travelers Companies ($27.6 billion)
- Progressive ($23.4 billion)
- Hartford Financial Services Group ($18.3 billion)
- Loews ($13.1 billion)
- XL Group ($10.5 billion)
- CNA Financial ($9.4 billion)

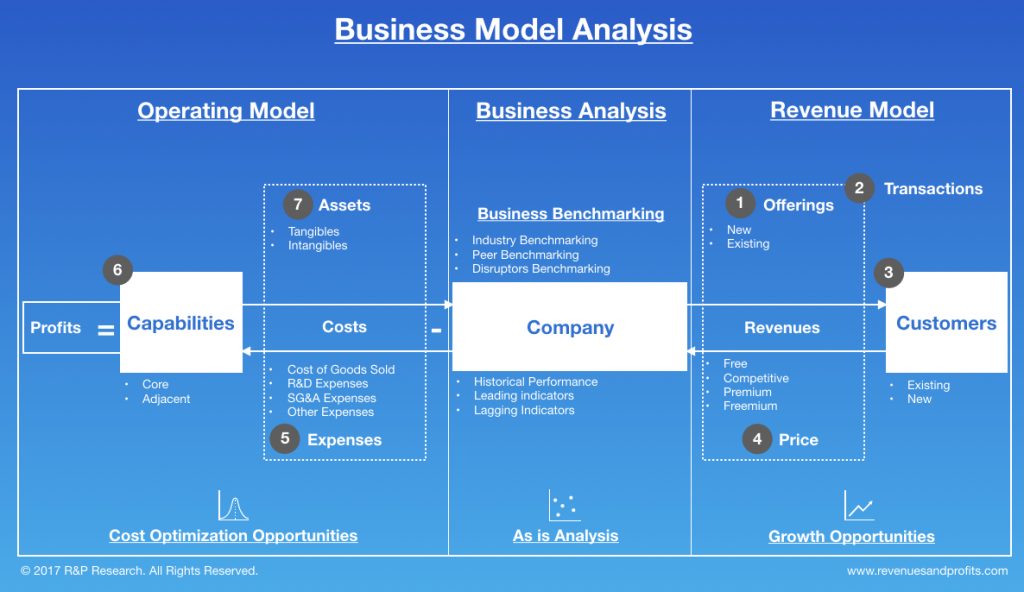
BUSINESS MODEL ANALYSIS (BMA) FRAMEWORK
We use the following framework to assess the business model of a company. Business Model Analysis framework can be used by organizations to articulate growth strategies and identify cost optimization opportunities. Technology and consulting companies can use this framework to identify the value drivers and pain points of their targeted customers. Entrepreneurs can use this framework to understand the language of business and identify promising business opportunities. This framework can be used by any professional aspiring to take up a leadership role to better understand the businesses challenges, articulate growth strategy, and monitor the business improvement requirements for the organization.
INDUSTRY PEERS AND COMPETITORS OF PROGRESSIVE
 Business Analysis – Analyze Historical Performance, Strategic Priorities, And Business Improvement Opportunities of Allstate")
Allstate (ALL) Business Analysis – Analyze Historical Performance, Strategic Priorities, And…
Allstate Corp with $37 billion revenues in the year 2016 was the number 3 Property & Casualty Insurance company. Read this report to know the top competitors of Allstate and identify growth and cost optimization opportunities of Allstate
Chubb (CB) Business Analysis – Analyze Historical Performance, Strategic Priorities, And…
Chubb Ltd with $31 billion revenues in the year 2016 was the number 4 Property & Casualty Insurance company. Read this report to know the top competitors of Chubb and identify growth and cost optimization opportunities of Chubb
Travelers Companies (TRV) Business Analysis – Analyze Historical Performance, Strategic Priorities,…
Travelers Companies, Inc. with $28 billion revenues in the year 2016 was the number 5 Property & Casualty Insurance company. Read this report to know the top competitors of Travelers Companies and identify growth and cost optimization opportunities of Travelers Companies
Hartford Financial Services Group (HIG) Business Analysis – Analyze Historical Performance,…
Hartford Financial Services Group Inc with $18 billion revenues in the year 2016 was the number 7 Property & Casualty Insurance company. Read this report to know the top competitors of Hartford Financial Services Group and identify growth and cost optimization opportunities of Hartford Financial Services Group
Loews (L) Business Analysis – Analyze Historical Performance, Strategic Priorities, And…
Loews Corp with $13 billion revenues in the year 2016 was the number 8 Property & Casualty Insurance company. Read this report to know the top competitors of Loews and identify growth and cost optimization opportunities of Loews
XL Group (XL) Business Analysis – Analyze Historical Performance, Strategic Priorities,…
XL Group Ltd with $11 billion revenues in the year 2016 was the number 9 Property & Casualty Insurance company. Read this report to know the top competitors of XL Group and identify growth and cost optimization opportunities of XL Group
REVENUES ANALYSIS
 Revenues And Revenue Growth From 2012 To 2016")
Progressive (PGR) Revenues And Revenue Growth From 2012 To 2016
This report provides the last five years revenues and revenue growth of Progressive Corp (PGR) from 2012 to 2016. Progressive generated a total of $23.4 billion revenues during 2016. Progressive reported a revenue growth of 12.4% year-over-year during 2016. The revenues and the revenue growth correspond to the fiscal year ending in December.
Progressive (PGR) Revenues And Revenue Growth From 2002 To 2016
This report provides the last fifteen years revenues and revenue growth of Progressive Corp (PGR) from 2002 to 2016. Progressive generated a total of $23.4 billion revenues during 2016. Progressive reported a revenue growth of 12.4% year-over-year during 2016. The revenues and the revenue growth correspond to the fiscal year ending in December.
Progressive (PGR) Revenue Growth Comparison With Industry Growth From 2012 To…
This report provides a comparison of Progressive Corp (PGR) revenue growth with Property & Casualty Insurance industry growth during the last five years from 2012 to 2016. Progressive reported a revenue growth of 12.4% year-over-year during 2016. The Property & Casualty Insurance industry growth was 6.6% year-over-year during 2016. Progressive growth was faster than the industry during 2016.
PROFIT ANALYSIS
 Net Profit And Net Margin From 2012 To 2016")
Progressive (PGR) Net Profit And Net Margin From 2012 To 2016
This report provides the last five years net profit and net margin of Progressive Corp (PGR) from 2012 to 2016. Progressive reported a total net income of $1 billion during 2016. Progressive generated a total of $23.4 billion revenues during 2016. Progressive net profit margin was 4.4% during 2016. The net profit and the net profit margin correspond to the fiscal year ending in December.
Progressive (PGR) Net Profit And Net Margin From 2002 To 2016
This report provides the last fifteen years net profit and net margin of Progressive Corp (PGR) from 2002 to 2016. Progressive reported a total net income of $1 billion during 2016. Progressive generated a total of $23.4 billion revenues during 2016. Progressive net profit margin was 4.4% during 2016. The net profit and the net profit margin correspond to the fiscal year ending in December.
Progressive (PGR) Net Profit Margin Comparison With Industry From 2012 To…
This report provides a comparison of Progressive Corp (PGR) net profit margin with Property & Casualty Insurance industry net profit margin during the last five years from 2012 to 2016. Progressive reported a net profit margin of 4.4% during 2016. The Property & Casualty Insurance industry net profit margin was 8.2% during 2016. Progressive was less profitable than the industry during 2016.
COST EXPENSES ANALYSIS
 Cost of Sales (COGS) Analysis From 2012 To 2016")
Progressive (PGR) Cost of Sales (COGS) Analysis From 2012 To 2016
This report provides the last five years cost of sales (COGS) analysis of Progressive Corp (PGR) from 2012 to 2016. Progressive spent a total of $16.9 billion on COGS during 2016. Progressive generated a total of $23.4 billion revenues during 2016. As a percentage of revenues, Progressive spent 72% of its total revenues on COGS during 2016. The cost of sales (COGS) numbers are for the fiscal year ending in December.
Progressive (PGR) Research & Development (R&D) Spending Analysis 2016
R&D; spending analysis for Progressive is not available because either the company does not provide the data or we don’t have it.
Progressive (PGR) Sales, Marketing, General & Administrative (SG&A) Spending Analysis From…
This report provides the last five years sales, marketing, general & administrative (SG&A;) expenses of Progressive Corp (PGR) from 2012 to 2016. Progressive spent a total of $4.8 billion on sales, marketing, general, and administrative (SG&A;) activities during 2016. Progressive generated a total of $23.4 billion revenues during 2016. As a percentage of revenues, Progressive spent 20.6% of its total revenues on SG&A; activities during 2016. The SG&A; spending numbers are for the fiscal year ending in December.
WORKING CAPITAL ANALYSIS
 Inventory Spending Analysis 2016")
Progressive (PGR) Inventory Spending Analysis 2016
Inventory spending analysis for Progressive is not available because either the company does not provide the data or we don’t have it.
Progressive (PGR) Accounts Receivable (A/R) Analysis From 2012 To 2016
This report provides the last five years Accounts Receivable (A/R) analysis of Progressive Corp (PGR) from 2012 to 2016. Progressive invested a total of $4.7 billion on accounts receivable during 2016. Progressive generated a total of $23.4 billion revenues during 2016. As a percentage of revenues, Progressive invested 20% of its total revenues on accounts receivable during 2016. The accounts receivable numbers are for the fiscal year ending in December.
Progressive (PGR) Accounts Payable (A/P) Analysis From 2012 To 2016
This report provides the last five years Accounts Payable (A/P) analysis of Progressive Corp (PGR) from 2012 to 2016. Progressive invested a total of $2.9 billion on accounts payable during 2016. Progressive generated a total of $23.4 billion revenues during 2016. As a percentage of revenues, Progressive invested 12.3% of its total revenues on accounts payable activities during 2016. The accounts payable numbers are for the fiscal year ending in December.
ASSET MANAGEMENT ANALYSIS
 Property, Plant & Equipment (PP&E) Investment Analysis From 2012 To 2016")
Progressive (PGR) Property, Plant & Equipment (PP&E) Investment Analysis From 2012…
This report provides the last five years property, plant & equipment (PP&E;) investment analysis of Progressive Corp (PGR) from 2012 to 2016. Progressive invested a total of $1.2 billion on property, plant & equipment (PP&E;) activities during 2016. Progressive generated a total of $23.4 billion revenues during 2016. As a percentage of revenues, Progressive invested 5% of its total revenues on PP&E; activities during 2016. The PP&E; investment numbers are for the fiscal year ending in December.
Progressive (PGR) Intangible Assets Analysis From 2015 To 2016
This report provides the last two years Intangible assets analysis of Progressive Corp (PGR) from 2015 to 2016. Progressive invested a total of $882.2 million on Intangible assets during 2016. Progressive generated a total of $23.4 billion revenues during 2016. As a percentage of revenues, Progressive invested 3.8% of its total revenues on intangible assets during 2016. The Intangible asset numbers are for the fiscal year ending in December.


