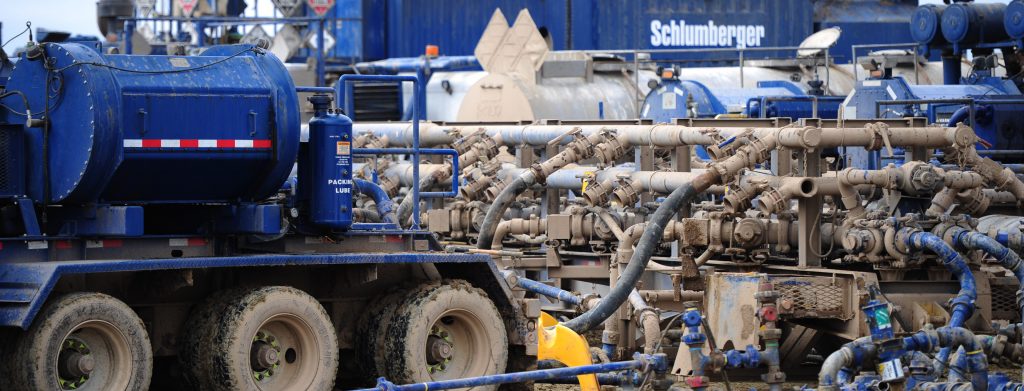
Schlumberger Limited supplies technology products and services to the oil and gas exploration and production industry worldwide. Its Reservoir Characterization Group segment provides reservoir imaging, monitoring, and development services; wireline technologies for open and cased-hole services; slickline services; exploration and production pressure and flow-rate measurement services comprising surface and downhole services; software integrated solutions, such as software, consulting, information management, and IT infrastructure services; consulting services for reservoir characterization, field development planning, and production enhancement; and petrotechnical data services and training solutions, as well as integrated management services. Its Drilling Group segment designs, manufactures, and markets roller cone and fixed cutter drill bits; supplies drilling fluid systems; provides pressure drilling and underbalanced drilling solutions, and environmental services and products; mud logging services; land drilling rigs and support services; and well planning and drilling, engineering, supervision, logistics, procurement, contracting, and drilling rig management services, as well as bottom-hole-assembly, borehole-enlargement technologies, impact tools, tubulars, and tubular services. Its Production Group segment provides well services comprising pressure pumping, well cementing, and stimulation services; coiled tubing equipment; well completion services and equipment that include packers, safety valves, and sand control technology, as well as completions technology and equipment; artificial lifts; and integrated production and production management services. Its Cameron Group segment offers integrated subsea production systems; surface systems; drilling equipment and services; and valve products and measurement systems. The company was formerly known as Societe de Prospection Electrique. Schlumberger Limited was founded in 1926 and is based in Houston, Texas.

BUSINESS ANALYSIS OF SCHLUMBERGER
The Oil & Gas Sector is witnessing a major shakeup, new age business models in the industry are transforming both customers and businesses. Faced with this uncertainity, companies are investing resources to transform their business. An in-depth business analysis is a valuable resource to identify and articulate the need for a business model change. At R&P Research we believe, the starting point for a business analysis is Benchmarking. Business benchmarking can be done at various levels: 1) Industry Benchmarking 2) Peer Benchmarking 3) Disruptors Benchmarking. In this report, we share the snapshot of how Schlumberger compares against the industry on the major performance indicators. This analysis, along with peer group/disruptors benchmarking and revenue model understanding can help identify growth and cost optimization opportunities to maximize the value delivered by Schlumberger to its stakeholders. R&P Research Industry Intelligence Platform provides historical data for last 15 years with an easy to use benchmarking interface for an in-depth comparative business analysis.
- Revenue Growth: Schlumberger reported a revenue growth of -21.6% year-on-year during 2016. Oil & Gas Equipment and Services Industry grew at -33.3% in the same period
- COGS share of Revenues: As a percentage of revenue, Schlumberger spent 86.7% of its total revenues on COGS. Oil & Gas Equipment and Services industry average (COGS share of revenue) in the same period was 82.2%
- R&D; share of Revenues: As a percentage of revenue, Schlumberger spent 3.6% of its total revenues on R&D.; Oil & Gas Equipment and Services industry average R&D; spending in the same period was 1.6%
- SG&A; share of Revenues: As a percentage of revenue, Schlumberger spent 1.4% of its total revenues on Sales, Marketing, and General Administration (SG&A;). Oil & Gas Equipment and Services industry average SG&A; spending in the same period was 8.3%
- Inventory share of Revenues: As a percentage of revenue, Schlumberger spent 15.2% of its total revenues on Inventories. Oil & Gas Equipment and Services industry average Inventory spending in the same period was 16.1%
- Accounts Payable share of Revenues: As a percentage of revenue, Schlumberger invested 38.5% of its total revenues on Accounts Payable (A/P) Oil & Gas Equipment and Services industry average Accounts Payable investment in the same period was 16.8%
- Accounts Receivable share of Revenues: As a percentage of revenue, Schlumberger invested 33.8% of its total revenues on Accounts Receivable (A/R). Oil & Gas Equipment and Services industry average Accounts Receivable investment in the same period was 26.6%
- PP&E; share of Revenues: As a percentage of revenue, Schlumberger invested 46.1% of its total revenues on Property, Plants, and Equipments (PP&E;). Oil & Gas Equipment and Services industry average PPE investment in the same period was 127.7%
- Intangibles share of Revenues: As a percentage of revenue, Schlumberger invested 129.2% of its total revenues on Intangibles. Oil & Gas Equipment and Services industry average Intangibles investment in the same period was 56.5%
- Net Margins: Schlumberger Net Margins in the year 2016 were -6.1%. Oil & Gas Equipment and Services industry average Net Margins in the same period were -18.4%
SECTOR AND INDUSTRY ASSOCIATION OF SCHLUMBERGER
For the purpose of performance benchmarking of a company with a sector or industry average, R&P; Research associates every company with one sector and one industry. An industry consists of companies with related/similar business models. A sector comprises of a group of related/similar industries.
Schlumberger is associated with Oil & Gas Sector and Oil & Gas Equipment and Services Industry.
Oil & Gas sector is comprised of the following industries: Oil & Gas Production; Oil & Gas Distribution; Oil & Gas Equipment and Services; Alternative Energy. The definitions for each of the industries is as follows:
- Oil & Gas Production industry includes companies primarily engaged in operating oil & gas properties. Key activities may include exploration for crude petroleum and natural gas; drilling, completing, and equipping wells; and all other activities in the preparation of oil and gas up to the point of shipment from the producing property. It also includes companies engaged in crude petroleum refining and producing gasoline, kerosene, distillate fuel oils, residual fuel oils, and lubricants, through fractionation or straight distillation of crude oil.
- Oil & Gas Distribution industry includes companies primarily engaged in the pipeline transportation of petroleum, natural gas, and other commodities. It also includes companies primarily engaged in the wholesale and retail distribution of petroleum and petroleum products.
- Oil & Gas Equipment and Services industry includes companies primarily engaged in drilling wells for oil or gas field operations for others on a contract or fee basis. It also includes companies providing exploration services and machinery & equipment for oil and gas field operations.
- Alternative Energy industry includes companies that develop or manufacture renewable energy equipment utilizing sources such as solar, wind, geothermal, hydro, and waves. It also includes companies that produce alternative fuels such as methanol, ethanol, hydrogen and biofuels that are mainly used to power vehicles.
INDUSTRY RANKING OF SCHLUMBERGER
With $27.8 billion revenues, Schlumberger ranked number 1 of all the companies in the US Oil & Gas Equipment and Services industry. There were a total of 55 public companies in the US Oil & Gas Equipment and Services industry that had revenues greater than $50 million during 2016.
The top-10 companies in the US Oil & Gas Equipment and Services industry by revenues during 2016 were:
- Schlumberger ($27.8 billion)
- Halliburton ($15.9 billion)
- Baker Hughes ($9.8 billion)
- National Oilwell Varco ($7.3 billion)
- Weatherford International ($5.7 billion)
- Transocean ($4.2 billion)
- Ensco ($2.8 billion)
- McDermott International ($2.6 billion)
- Noble Corp ($2.3 billion)
- Oceaneering International ($2.3 billion)

BUSINESS MODEL ANALYSIS (BMA) FRAMEWORK
We use the following framework to assess the business model of a company. Business Model Analysis framework can be used by organizations to articulate growth strategies and identify cost optimization opportunities. Technology and consulting companies can use this framework to identify the value drivers and pain points of their targeted customers. Entrepreneurs can use this framework to understand the language of business and identify promising business opportunities. This framework can be used by any professional aspiring to take up a leadership role to better understand the businesses challenges, articulate growth strategy, and monitor the business improvement requirements for the organization.
