
In this article, we will look at the top-10 Medical Technology companies in the US by their 2016 revenues. First, we will share brief insights from our research on the top 3000 companies in the US. Then, we will provide the insights about the US Medical Technology sector. Finally, we will look at the revenues, year-on-year (YoY) revenue growth, net profits, and net profit margin of the top-10 companies in the Medical Technology sector.
Our Research on the Top 3000 Companies in the US
All the analysis in this article is from our proprietary financial database of the top 3000 public companies in the US (see notes at the bottom of the article for details). We call it R&P Screener.
It helps industry professionals and investors “quickly and easily” identify the following types of companies in any sector or industry:
- High growth, medium growth, low growth, or negative revenue growth companies;
- Highly profitable, moderately profitable, or loss-making companies;
- Top-n (top-5, top-10, top-20 etc.) companies by revenues, revenue growth, net profits, net profit growth or net profit margin;
- Mega, very large, large, or medium-size companies by their latest annual revenue.
- There is no doubt that medical technology companies are evolving. They are using the latest technological advancements and scientific methods to ensure that they are able to stay on top of their business operations and revenues. From boosting efficiency by using virtual staff to employing the use of Artificial Intelligence and Virtual Reality, medical support organizations like NEXA are pushing the boundaries of what is possible. This helps medical establishments to grow and provide a seamless customer service experience.

Here are some brief insights about the US top 3000 companies from the R&P Screener (April 2017 Update):
- The combined revenues of the US top 3000 companies were $14.49 trillion during 2016. The combined net income was $1.03 trillion.
- There were 54 Mega (revenues greater than $50 billion), 239 Very Large (revenues between $10 and $50 billion), 1097 Large (revenues between $1 and $10 billion), and 1610 Medium (revenues between $50 million and $1 billion) during 2016.
- There were 2224 companies (74.8% of the total) with positive net income and 756 companies (25.2% of the total) with negative net income during 2016.
- There were 1985 companies (66.2% of the total) with a positive revenue growth and 1015 companies (33.8% of the total) with a negative revenue growth during 2015-16.
- There were 1236 companies (41.2% of the total) with a positive net income growth and 800 companies (26.7% of the total) with a negative net income growth during 2015-16. For 964 companies (32.1% of the total), we could not compute net income growth because their net income was negative during 2015 or 2016.
- California, Texas, New York, Illinois, and Massachusetts are the top five states in terms of number of companies with headquarters locations. A total of 1309 companies (43.6% of the total) have headquarters in these states.
US Medical Technology Sector Revenues and Profits
R&P Screener provides revenues and profits details of 290 public companies in the Healthcare & Life Sciences sector in the US. The combined revenues of those companies were $2.24 trillion during 2016 and the combined net profit of those companies were $139.4 billion. The total revenues increased from $2.02 trillion during 2015 to $2.24 trillion during 2016 at an annual revenue growth rate of 10.7%.
The Medical Technology sector consists of 81 companies with a combined revenues of $133 billion during 2016. The industry includes companies primarily engaged in manufacturing and distribution of medical equipments and medical supplies. Medical equipments include large scale capital equipments such as X-Ray machines and MRI scanners and other non-disposable medical devices like stents and pacemakers. Medical supplies includes makers of contact lenses, eyeglass lenses, bandages and other disposable products.
US Top-10 Medical Technology Companies Revenues and Profits
The top-10 Medical Technology companies in the US by 2016 revenues are: Medtronic, Becton Dickinson & Co., Stryker Corp, Baxter International Inc, Boston Scientific Corp, Zimmer Biomet Holdings, Dentsply Sirona, C.R. Bard, Varian Medical Systems and, Edwards Life sciences. The revenues and profits details of these companies are as follows:
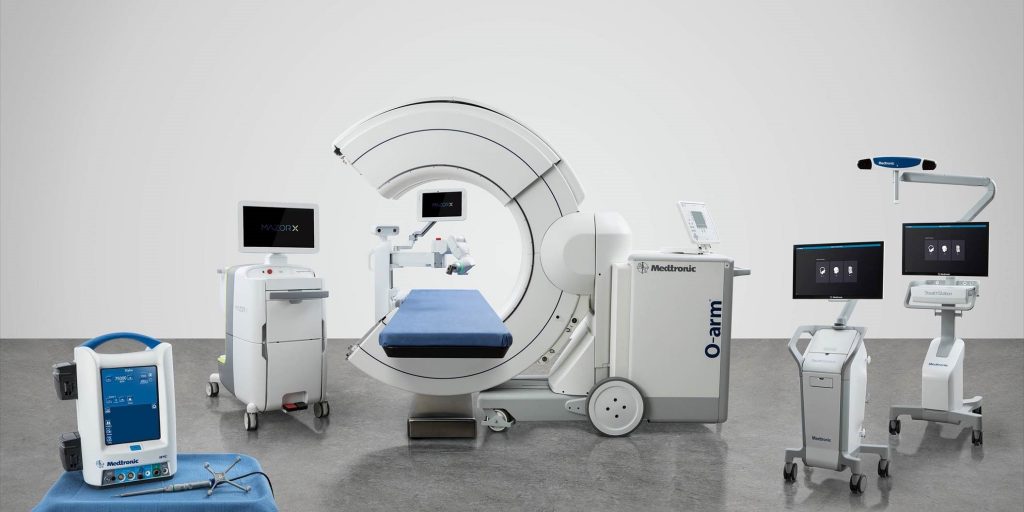
1. Medtronic PLC
Medtronic is ranked no. 1 in the ‘US Top-10 Medical Technology Companies by 2016 Revenues’ list. Medtronic, is a medical technology, services and solutions company. The Company operates in four segments: Cardiac and Vascular Group, Minimally Invasive Therapies Group, Restorative Therapies Group and Diabetes Group. The Cardiac and Vascular Group segment includes cardiac rhythm and heart failure, coronary and structural heart, and aortic and peripheral vascular. Its Minimally Invasive Therapies Group segment includes surgical solutions, and patient monitoring and recovery. Its Restorative Therapies Group segment includes spine, neuromodulation, surgical technologies and neurovascular. Its Diabetes Group segment includes intensive insulin management, non-intensive diabetes therapies, and diabetes services and solutions.
Medtronic generated $28.83 billion of revenues during 2016, up 42.3% yoy, from $ $20.26 billion in 2015. Medtronic reported a net income of $3.5 billion during 2016 and the net profit margin was 12.3%.
2. Becton Dickinson and Company
Becton Dickinson and Company (BD) is ranked no. 2 in the ‘US Top-10 Medical Technology Companies by 2016 Revenues’ list. BD, is a global medical technology company engaged in the development, manufacture and sale of a range of medical supplies, devices, laboratory equipment and diagnostic products. The Company operates through two segments: BD Medical and BD Life Sciences. It provides customer solutions that are focused on managing medication management and patient safety; supporting infection prevention practices; equipping surgical and interventional procedures; managing medication delivery; aiding anesthesiology care; managing the diagnosis of infectious diseases and cancers; advancing cellular research and applications, and supporting the management of diabetes.
BD generated $12.5 billion of revenues during 2016, up 21.4% yoy, from $10.3 billion in 2015. BD reported a net income of $976 Million during 2016 and the net profit margin was 7.8%.

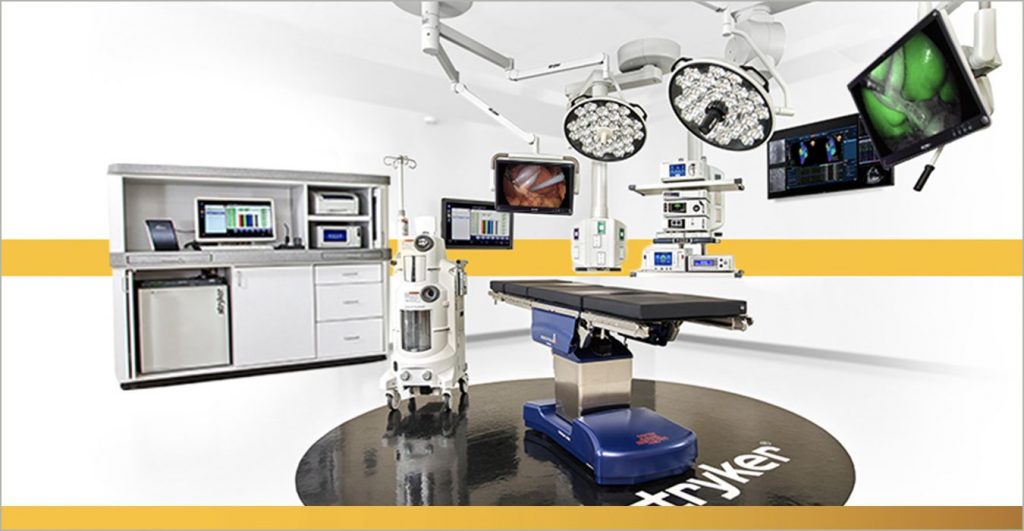
3. Stryker Corporation
Stryker Corporation (Stryker) is ranked no. 3 in the ‘US Top-10 Medical Technology Companies by 2016 Revenues’ list. Stryker, is a medical technology company. The Company offers a range of medical technologies, including orthopedic, medical and surgical, and neurotechnology and spine products. The Company’s segments include Orthopaedics; MedSurg; Neurotechnology and Spine, and Corporate and Other. The Orthopaedics segment includes reconstructive (hip and knee) and trauma implant systems and other related products. The Company’s MedSurg segment consists of instruments, endoscopy, medical and sustainability products. The Neurotechnology and Spine segment includes neurovascular products, spinal implant systems and other related products.
Stryker generated $11.3 billion of revenues during 2016, up 13.9% yoy, from $9.9 billion in 2015. Stryker reported a net income of $1.6 billion during 2016 and the net profit margin was 14.5%.
4. Baxter International
Baxter International (Baxter) is ranked no. 4 in the ‘US Top-10 Medical Technology Companies by 2016 Revenues’ list. Baxter, through its subsidiaries, provides a portfolio of essential renal and hospital products, including acute and chronic dialysis; sterile intravenous (IV) solutions; infusion systems and devices; parenteral nutrition therapies; premixed and oncolytic injectables; biosurgery products and anesthetics; medication reconstitution systems, and pharmacy automation, software and services. The Company operates through two segments: Hospital Products and Renal.
Baxter generated $10.2 billion of revenues during 2016, up 2.0% yoy, from $9.9 billion in 2015. Baxter reported a net income of $4.9 billion during 2016 and the net profit margin was 48.9%.

5. Boston Scientific Corporation
Boston Scientific Corporation is ranked no. 5 in the ‘US Top-10 Medical Technology Companies by 2016 Revenues’ list. Boston Scientific Corporation, is a developer, manufacturer and marketer of medical devices that are used in a range of interventional medical specialties. The Company offers its products through seven businesses: interventional cardiology, cardiac rhythm management, endoscopy, peripheral interventions, urology and pelvic health, neuromodulation, and electrophysiology. It operates through three segments: Cardiovascular, Rhythm Management, and MedSurg. Its Cardiovascular segment consists of Interventional Cardiology and Peripheral Interventions businesses. Rhythm Management consists of Cardiac Rhythm Management and Electrophysiology businesses. MedSurg consists of Endoscopy, Urology and Pelvic Health, and Neuromodulation businesses.
Boston Scientific Corporation generated $8.4 billion of revenues during 2016, up 12.2% yoy, from $7.5 billion in 2015. Boston Scientific Corporation reported a net income of $347 million during 2016 and the net profit margin was 4.1%.

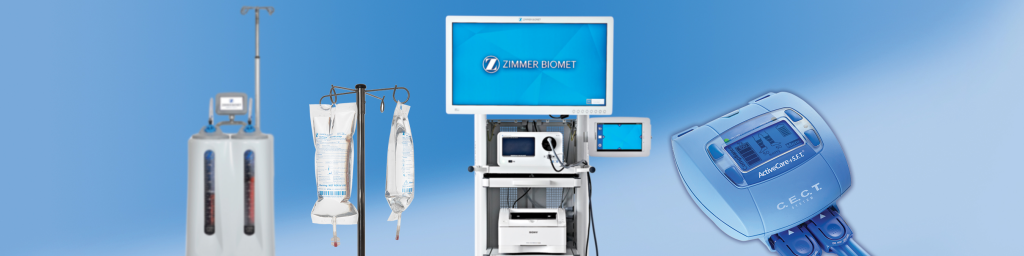
6. Zimmer Biomet Holdings, Inc.
Zimmer Biomet Holdings, Inc. (Zimmer Biomet) is ranked no. 6 in the ‘US Top-10 Medical Technology Companies by 2016 Revenues’ list. Zimmer, is engaged in designing, manufacturing and marketing of orthopedic reconstructive products; sports medicine, biologics, extremities and trauma products; office-based technologies; spine, craniomaxillofacial and thoracic products; dental implants, and related surgical products. The Company’s products and solutions help treat patients suffering from disorders of, or injuries to, bones, joints or supporting soft tissues. The Company manages its operations through three geographic operating segments: the Americas, consisting principally of the United States and other North, Central and South American markets; EMEA, consisting principally of Europe and the Middle East and African markets, and Asia Pacific, consisting primarily of Japan and other Asian and Pacific markets.
Zimmer Biomet generated $7.7 billion of revenues during 2016, up 28.1% yoy, from $5.9 billion in 2015. Zimmer Biomet reported a net income of $306 million during 2016 and the net profit margin was 4.0%.
7. Dentsply Sirona Inc.
Dentsply Sirona Inc. (Dentsply) is ranked no. 7 in the ‘US Top-10 Medical Technology Companies by 2016 Revenues’ list. Dentsply, is a manufacturer of professional dental products and technologies. The Company develops, manufactures, and markets solutions offering, including dental and oral health products, as well as other consumable medical devices. The Company operates through two segments: Dental and Healthcare Consumables, and Technologies. The dental industry encompasses the diagnosis, treatment and prevention of disease and ailments of the teeth, gums and supporting bone. The Company’s principal dental product categories are dental consumable products, dental laboratory products, dental specialty products and dental equipment. Additionally, the Company’s consumable medical device products are used for urological and surgical applications. Dental technology products consist of basic and high-tech dental equipment, such as treatment centers, imaging equipment and computer aided design and machining (CAD/CAM) systems equipment for dental practitioners and laboratories
Dentsply generated $3.7 billion of revenues during 2016, up 40.0% yoy, from $2.7 billion in 2015. Dentsply reported a net income of $430 million during 2016 and the net profit margin was 11.5%.

8. C.R. Bard Inc.
C.R. Bard Inc. (Bard) is ranked no. 8 in the ‘US Top-10 Medical Technology Companies by 2016 Revenues’ list. Bard, is engaged in designing, manufacturing, packaging, distribution and sale of medical, surgical, diagnostic and patient care devices. The Company sells a range of products to hospitals, individual healthcare professionals, extended care facilities and alternate site facilities on a global basis. The Company reports its sales in four product group categories: vascular, urology, oncology and surgical specialty.
Bard generated $3.7 billion of revenues during 2016, up 8.7% yoy, from $3.4 billion in 2015. Bard reported a net income of $531 million during 2016 and the net profit margin was 14.3%.

9. Varian Medical Systems, Inc.
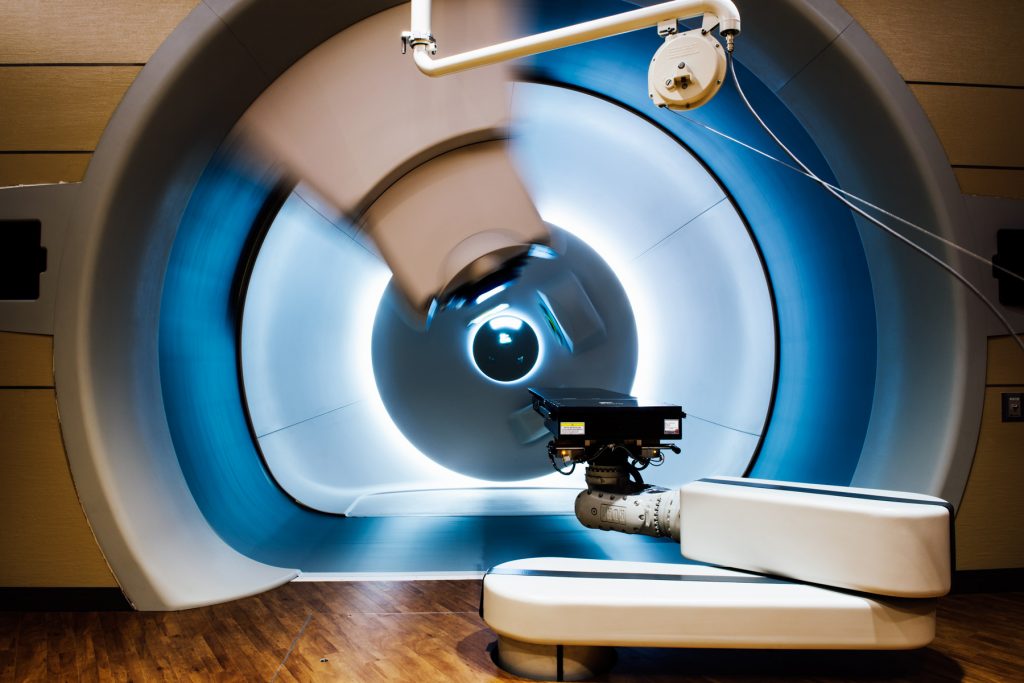
Varian Medical Systems, Inc. (Varian) is ranked no. 9 in the ‘US Top-10 Medical Technology Companies by 2016 Revenues’ list. Varian, is a manufacturer of medical devices and software for treating cancer and other medical conditions with radiotherapy, radiosurgery, proton therapy and brachytherapy medical devices and software. The Company also has Varian Particle Therapy (VPT) and the operations of the Ginzton Technology Center (GTC). Its VPT business develops, designs, manufactures, sells and services products and systems for delivering proton therapy, another form of external beam radiotherapy using proton beams for the treatment of cancer. Its ProBeam system is capable of delivering intensity modulated proton therapy (IMPT) using pencil beam scanning technology. Its ProBeam Compact is a single room proton therapy product.
Varian generated $3.2 billion of revenues during 2016, up 3.8% yoy, from $3.2 billion in 2015. Varian reported a net income of $405 million during 2016 and the net profit margin was 12.5%.
10. Edwards Lifesciences Corporation
Edwards Lifesciences Corporation (Edward Lifesciences) is ranked no. 10 in the ‘US Top-10 Medical Technology Companies by 2016 Revenues’ list. Edwards Lifesciences, is a manufacturer of heart valve systems and repair products used to replace or repair a patient’s diseased or defective heart valve. The Company is globally engaged in patient-focused innovations for structural heart disease and critical care monitoring. Its segments include United States, Europe, Japan and Rest of World. Its products are categorized into three areas: Transcatheter Heart Valve Therapy, Surgical Heart Valve Therapy and Critical Care. It also develops hemodynamic monitoring systems that are used to measure a patient’s cardiovascular function in the hospital setting.
Edward Lifesciences generated $2.9 billion of revenues during 2016, up 18.8% yoy, from $2.5 billion in 2015. Edward Lifesciences reported a net income of $570 million during 2016 and the net profit margin was 19.2%.

Notes
1- Fiscal Year versus Calendar Year
The reported revenues and net income correspond to the fiscal year of the companies. If a company’s fiscal year ended in September 2016, then we report revenues for the twelve-months period ending in September 2016. Similarly, if a company’s fiscal year ended in May 2016, then we report revenues for the twelve-months period ending in May 2016.
2- Which companies are included in the R&P Screener?
- R&P Screener includes US Companies listed in New York Stock Exchange (NYSE), Nasdaq, and Amex (now known as NYSE markets). These companies regularly file their quarterly (10-Q) and annual (10-K) reports with Securities and Exchange Commission (SEC) in the US. These companies were incorporated in US and have headquarters in US as well.
- US companies that were founded in US, but have headquarters outside the US are also included. These companies have headquarters outside the US due to taxation benefits, foreign governments incentives, proximity to customers, or some other reasons. Since more than 50% of the stocks of these companies are traded in US stock exchanges, they file 10-Ks and 10-Qs similar to the US-headquartered companies.
- All the companies in the R&P Screener had revenues of more then $50 million in 2016.
3- Which companies are not included in the R&P Screener?
- US companies listed in OTC markets.
- Private companies in the US.
- Any companies delisted from NYSE, Nasdaq, or Amex stock exchanges. These companies may have been acquired, filed for bankruptcy, or may have become private entities.
- Any foreign companies listed in US stock exchanges. These companies do not file 10-Q or 10-K. Instead, they provide their annual financial information in 20-F reports.


