
In this post, we provide an analysis of Twitter Q2 2015 earnings. The analysis is provided through a presentation over SlideShare. The presentation provides Twitter’s overall revenues and profits analysis, business and geographic segments revenue analysis, and monthly active users analysis. The post discusses the two key challenges faced by Twitter – Users’ growth and User engagement.
Twitter announced Q2 2015 financial results on July 28, 2015. Q2 2015 revenues reached $502 million, up 61% YoY. Q2 GAAP net loss was $137 million. Speaking on the results, Jack Dorsey, interim CEO of Twitter, said, “Our Q2 results show good progress in monetization, but we are not satisfied with our growth in the audience”.
Then, in the earnings conference call later, CFO Anthony Noto said that the company would not see “sustained meaningful growth in MAUs” for a “considerable period of time”. The investors didn’t like that. The stock went down 12%.

Twitter Users Growth Challenge
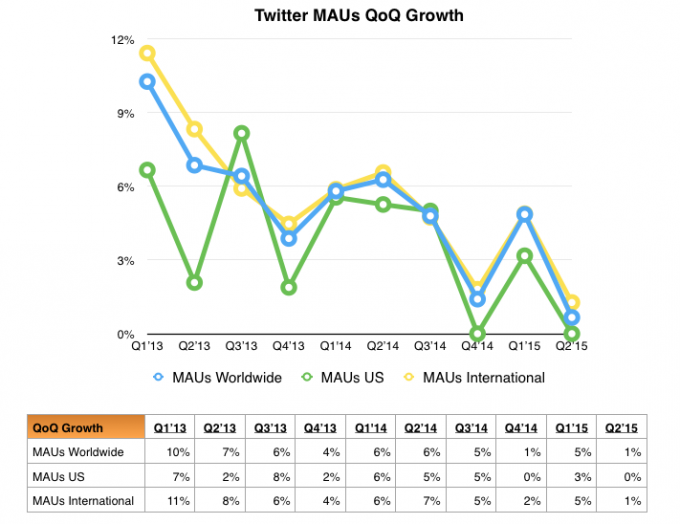
Twitter monthly active users (MAUs) quarter-over-quarter (QoQ) growth almost flattened out in Q2 2015. Twitter’s total MAUs (excluding SMS fast followers) were 304 million in the second quarter, up 1% QoQ. There was no QoQ growth in the US MAUs. They remained at 65 million in the second quarter, the same as the first quarter. Reviving the user growth is the first biggest challenge for Twitter.
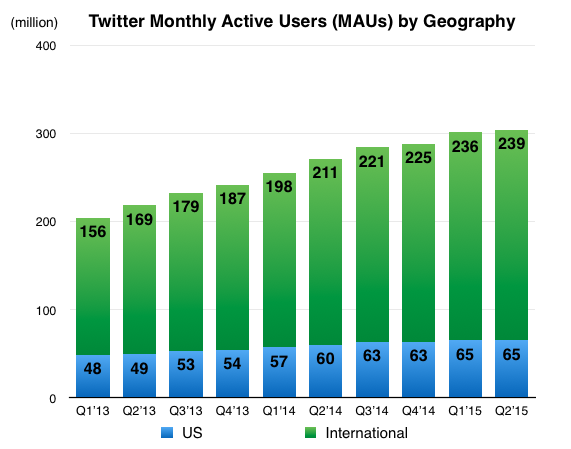
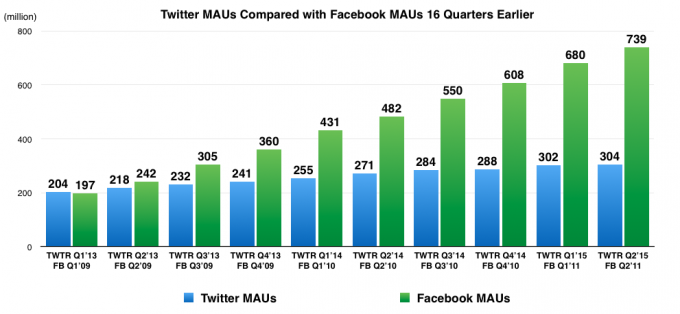
Over the last 9 quarters, Twitter has added a total of 100 million MAUs. Twitter’s total MAUs were 204 million in Q1 2013. Twitter’s total MAUs reached 304 million in Q2 2015. A comparison of Twitter current MAUs with the Facebook current MAUs won’t be fair. If we go back four years to Q1 2009, Facebook had 197 million MAUs worldwide.
This is somewhat comparable to Twitter’s total MAUs in Q1 2013. Nine quarters later, Facebook MAUs reached 739 million in Q2 2011. So, Facebook added 542 million MAUs in those nine quarters. This means, if we keep the user base as the same, Facebook added 5.4-times more MAUs than Twitter in the same time period. It seems very unlikely that Twitter will be able to ever match the user base of Facebook. It may be due to the nature of the social network.
Twitter User Engagement Challenge
One of the metrics for measuring user engagement is the DAU-to-MAU (daily active users to monthly active users) ratio. If this ratio is increasing, it means that more MAUs are accessing the website on a daily basis. Therefore, the overall user engagement is increasing. It is not a perfect measure, but it is a good enough measure to see the overall user engagement trend.
As per Twitter CFO, during the earnings conference call, the DAU-to-MAU ratio for their top 20 markets was approximately 44% in Q2 2015. This is down from 48% in the first three quarters of 2014.
So, user engagement has come down in the last few quarters. Increasing user engagement is the second biggest challenge for Twitter. They will be able to attract more advertisers, and hence more revenues, only when their user base and the user engagement is increasing.

Since Twitter does not report its daily active users, it is very difficult to analyze the DAU-to-MAU ratio trend. Analysts have to rely on the management inputs from the earnings conference calls. On the contrary, Facebook does report daily active users and monthly active users by geography every quarter.
Just for the sake of comparison, here are the Facebook DAU-to-MAU ratio by geography for Q1 2015: US & Canada – 75.5%; Europe – 72.1%; Asia – 56.3%; Rest of the World – 60.3%; Worldwide – 63.9%. Facebook user engagement has been consistently increasing over the last several years. Facebook will report Q2 2015 earnings on July 29, 2015.
Twitter Business Analysis Presentation Q2 2015
Please refer to the presentation below over SlideShare for:
- Twitter overall revenues and profits analysis
- Twitter business and geographic segments revenue analysis
- Twitter advertising revenues by device type – desktop vs mobile
- Twitter monthly active users analysis
If the fonts in the charts appear small, please view the presentation in full-screen mode.


