
Wal-Mart Stores, Inc. operates retail stores in various formats worldwide. It operates through three segments: Walmart U.S., Walmart International, and Sam’s Club.
The company operates discount stores, supermarkets, supercenters, hypermarkets, warehouse clubs, cash and carry stores, home improvement stores, specialty electronics stores, apparel stores, medication stores, convenience stores, and membership-only warehouse clubs; and retail Websites, such as walmart.com and samsclub.com, as well as mobile commerce applications. It offers grocery products, including meat, produce, natural and organics, deli and bakery, dairy, frozen foods, floral and dry grocery, as well as consumables, such as health and beauty aids, baby products, household chemicals, paper goods, and pet supplies; and health and wellness products, which include pharmacy, optical services, clinical services, over-the-counter medications, and other medical products. The company also provides electronics, cameras and supplies, photo processing services, cellular phones, cellular service plan contracts and prepaid service, movies, music, video games, and books; stationery, automotive, hardware and paint, sporting goods, and outdoor living and horticulture, as well as fabrics, crafts, and seasonal merchandise; apparel for women, girls, men, boys, and infants, as well as shoes, jewelry, and accessories; and home furnishings, housewares and small appliances, bedding, home decor and toys.
In addition, it offers fuel and financial services and related products, including money orders, prepaid cards, wire transfers, money transfers, check cashing, and bill payment. In addition, it offers brand name merchandise, including hard goods, soft goods and selected private-label items, such as Member’s Mark.
It operates 11,695 stores under 59 banners in 28 countries and e-commerce Websites in 11 countries. Wal-Mart Stores, Inc. was founded in 1945 and is headquartered in Bentonville, Arkansas.
BUSINESS ANALYSIS OF WALMART
The Retail Sector is witnessing a major shakeup, new age business models in the industry are transforming both customers and businesses. Faced with this uncertainty, companies are investing resources to transform their business. An in-depth business analysis is a valuable resource to identify and articulate the need for a business model change.
At R&P Research we believe, the starting point for a business analysis is Benchmarking. Business benchmarking can be done at various levels: 1) Industry Benchmarking 2) Peer Benchmarking 3) Disruptors Benchmarking. In this report, we share the snapshot of how Walmart compares against the industry on the major performance indicators. This analysis, along with peer group/disruptors benchmarking and revenue model understanding can help identify growth and cost optimization opportunities to maximize the value delivered by Walmart to its stakeholders.
R&P Research Industry Intelligence Platformprovides historical data for last 15 years with an easy to use benchmarking interface for an in-depth comparative business analysis.
- Revenue Growth: Walmart reported a revenue growth of -0.7% year-on-year during 2016. Broadline Retail Industry grew at 0.3% in the same period
- COGS share of Revenues: As a percentage of revenue, Walmart spent 74.9% of its total revenues on COGS. Broadline Retail industry average (COGS share of revenue) in the same period was 74.8%
- R&D; share of Revenues: Walmart R&D; share of Revenues details are not available because either company does not share the data or we do not have it
- SG&A; share of Revenues: As a percentage of revenue, Walmart spent 20.1% of its total revenues on Sales, Marketing, and General Administration (SG&A;). Broadline Retail industry average SG&A; spending in the same period was 19.8%
- Inventory share of Revenues: As a percentage of revenue, Walmart spent 9.2% of its total revenues on Inventories. Broadline Retail industry average Inventory spending in the same period was 11.0%
- Accounts Payable share of Revenues: As a percentage of revenue, Walmart invested 8.0% of its total revenues on Accounts Payable (A/P) Broadline Retail industry average Accounts Payable investment in the same period was 8.5%
- Accounts Receivable share of Revenues: As a percentage of revenue, Walmart invested 1.2% of its total revenues on Accounts Receivable (A/R). Broadline Retail industry average Accounts Receivable investment in the same period was 1.3%
- PP&E; share of Revenues: As a percentage of revenue, Walmart invested 24.2% of its total revenues on Property, Plants, and Equipments (PP&E;). Broadline Retail industry average PPE investment in the same period was 23.2%
- Intangibles share of Revenues: As a percentage of revenue, Walmart invested 3.5% of its total revenues on Intangibles. Broadline Retail industry average Intangibles investment in the same period was 5.1%
- Net Margins: Walmart Net Margins in the year 2016 were 3.0%. Broadline Retail industry average Net Margins in the same period were 2.7%
SECTOR AND INDUSTRY ASSOCIATION OF WALMART
For the purpose of performance benchmarking of a company with a sector or industry average, R&P; Research associates every company with one sector and one industry. An industry consists of companies with related/similar business models. A sector comprises of a group of related/similar industries.
Walmart is associated with Retail Sector and Broadline Retail Industry.
Retail sector is comprised of the following industries: Broadline Retail; Grocery Retail; Specialty Retail; Apparel Retail; Home Improvement Retail; Specialized Consumer Services. The definitions for each of the industries is as follows:
- Broadline Retail industry includes retail outlets and wholesalers offering a wide variety of products including both hard goods and soft goods.
- Grocery Retail industry includes retail stores that primarily offer non-perishable food that is packaged in cans, bottles and boxes, with some also having fresh produce, butchers, delis, and bakeries
- Specialty Retail industry includes retailers and wholesalers concentrating on a Single Class of Goods, such as electronics, books, automotive parts or closeouts. It also includes automobile dealerships, video rental stores, dollar stores, duty-free shops and automotive fuel stations not owned by oil companies.
- Apparel Retail industry consists of retailers and wholesalers specializing mainly in Clothing, Shoes, Jewelry, Sunglasses and Other accessories.
- Home Improvement Retail industry includes retailers and wholesalers concentrating on the sale of home improvement products, including Garden Equipment, Carpets, Wallpaper, Paint, Home Furniture, Blinds and Curtains and Building materials.
- Specialized Consumer Services industry includes providers of consumer services such as Auction Houses, Day-care Centers, Dry Cleaners, Schools, Consumer Rental Companies, Veterinary Clinics, Hair Salons and providers of Funeral, Lawn-maintenance, Consumer-storage, Heating and Cooling installation and Plumbing services.

INDUSTRY RANKING OF WALMART
With $482.1 billion revenues, Walmart ranked number 1 of all the companies in the US Broadline Retail industry. There were a total of 21 public companies in the US Broadline Retail industry that had revenues greater than $50 million during 2016.
The top-10 companies in the US Broadline Retail industry by revenues during 2016 were:
- Walmart ($482.1 billion)
- Costco ($118.7 billion)
- Target ($73.8 billion)
- Macy’s ($27.1 billion)
- Sears Holdings ($25.1 billion)
- Dollar General ($20.4 billion)
- Kohl’s ($19.2 billion)
- Dollar Tree ($15.5 billion)
- J. C. Penney ($12.6 billion)
- Dillard’s ($6.8 billion)

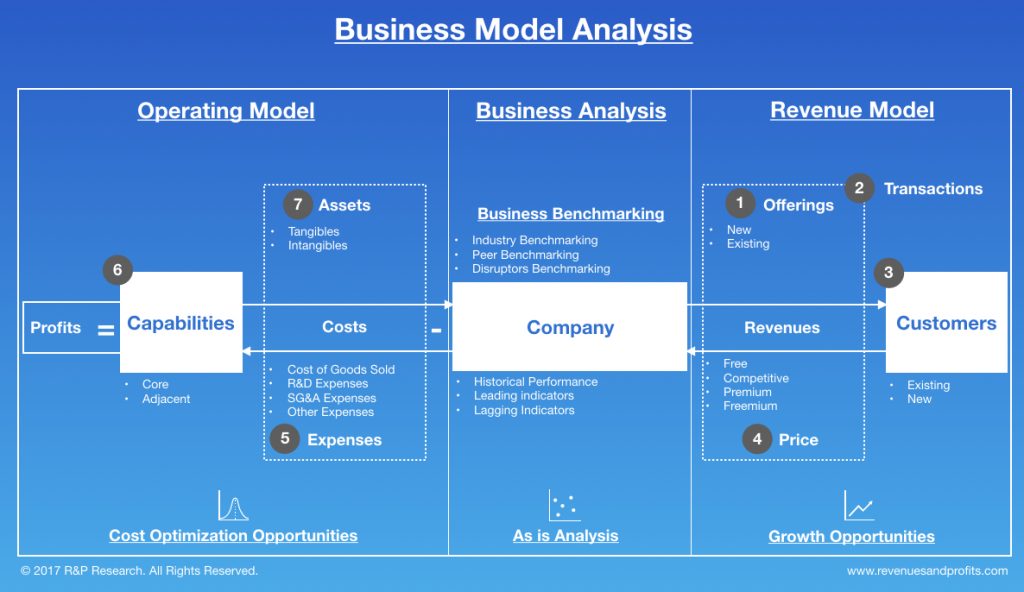
BUSINESS MODEL ANALYSIS (BMA) FRAMEWORK
We use the following framework to assess the business model of a company. Business Model Analysis framework can be used by organizations to articulate growth strategies and identify cost optimization opportunities. Technology and consulting companies can use this framework to identify the value drivers and pain points of their targeted customers. Entrepreneurs can use this framework to understand the language of business and identify promising business opportunities. This framework can be used by any professional aspiring to take up a leadership role to better understand the businesses challenges, articulate growth strategy, and monitor the business improvement requirements for the organization.
INDUSTRY PEERS AND COMPETITORS OF WALMART

Costco (COST) Business Analysis – Analyze Historical Performance, Strategic Priorities, And…
Costco Wholesale Corp with $119 billion revenues in the year 2016 was the number 2 Broadline Retail company. Read this report to know the top competitors of Costco and identify growth and cost optimization opportunities of Costco
Target (TGT) Business Analysis – Analyze Historical Performance, Strategic Priorities, And…
Target Corp with $74 billion revenues in the year 2016 was the number 3 Broadline Retail company. Read this report to know the top competitors of Target and identify growth and cost optimization opportunities of Target
Macy’s (M) Business Analysis – Analyze Historical Performance, Strategic Priorities, And…
Macy’s, Inc. with $27 billion revenues in the year 2016 was the number 4 Broadline Retail company. Read this report to know the top competitors of Macy’s and identify growth and cost optimization opportunities of Macy’s
Sears Holdings (SHLD) Business Analysis – Analyze Historical Performance, Strategic Priorities,…
Sears Holdings Corp with $25 billion revenues in the year 2016 was the number 5 Broadline Retail company. Read this report to know the top competitors of Sears Holdings and identify growth and cost optimization opportunities of Sears Holdings
Dollar General (DG) Business Analysis – Analyze Historical Performance, Strategic Priorities,…
Dollar General Corp with $20 billion revenues in the year 2016 was the number 6 Broadline Retail company. Read this report to know the top competitors of Dollar General and identify growth and cost optimization opportunities of Dollar General
Kohl’s (KSS) Business Analysis – Analyze Historical Performance, Strategic Priorities, And…
Kohl’s Corp with $19 billion revenues in the year 2016 was the number 7 Broadline Retail company. Read this report to know the top competitors of Kohl’s and identify growth and cost optimization opportunities of Kohl’s
REVENUES ANALYSIS

Walmart (WMT) Revenues And Revenue Growth From 2012 To 2016
This report provides the last five years revenues and revenue growth of Wal-Mart Stores Inc (WMT) from 2012 to 2016. Walmart generated a total of $482.1 billion revenues during 2016. Walmart reported a revenue growth of -0.7% year-over-year during 2016. The revenues and the revenue growth correspond to the fiscal year ending in January.
Walmart (WMT) Revenues And Revenue Growth From 2002 To 2016
This report provides the last fifteen years revenues and revenue growth of Wal-Mart Stores Inc (WMT) from 2002 to 2016. Walmart generated a total of $482.1 billion revenues during 2016. Walmart reported a revenue growth of -0.7% year-over-year during 2016. The revenues and the revenue growth correspond to the fiscal year ending in January.
Walmart (WMT) Revenue Growth Comparison With Industry Growth From 2012 To…
This report provides a comparison of Wal-Mart Stores Inc (WMT) revenue growth with Broadline Retail industry growth during the last five years from 2012 to 2016. Walmart reported a revenue growth of -0.7% year-over-year during 2016. The Broadline Retail industry growth was 0.3% year-over-year during 2016. Walmart growth was slower than the industry during 2016.
PROFIT ANALYSIS

Walmart (WMT) Net Profit And Net Margin From 2012 To 2016
This report provides the last five years net profit and net margin of Wal-Mart Stores Inc (WMT) from 2012 to 2016. Walmart reported a total net income of $14.7 billion during 2016. Walmart generated a total of $482.1 billion revenues during 2016. Walmart net profit margin was 3% during 2016. The net profit and the net profit margin correspond to the fiscal year ending in January.
Walmart (WMT) Net Profit And Net Margin From 2002 To 2016
This report provides the last fifteen years net profit and net margin of Wal-Mart Stores Inc (WMT) from 2002 to 2016. Walmart reported a total net income of $14.7 billion during 2016. Walmart generated a total of $482.1 billion revenues during 2016. Walmart net profit margin was 3% during 2016. The net profit and the net profit margin correspond to the fiscal year ending in January.
Walmart (WMT) Net Profit Margin Comparison With Industry From 2012 To…
This report provides a comparison of Wal-Mart Stores Inc (WMT) net profit margin with Broadline Retail industry net profit margin during the last five years from 2012 to 2016. Walmart reported a net profit margin of 3% during 2016. The Broadline Retail industry net profit margin was 2.7% during 2016. Walmart was more profitable than the industry during 2016.
COST EXPENSES ANALYSIS

Walmart (WMT) Cost of Sales (COGS) Analysis From 2012 To 2016
This report provides the last five years cost of sales (COGS) analysis of Wal-Mart Stores Inc (WMT) from 2012 to 2016. Walmart spent a total of $361 billion on COGS during 2016. Walmart generated a total of $482.1 billion revenues during 2016. As a percentage of revenues, Walmart spent 74.9% of its total revenues on COGS during 2016. The cost of sales (COGS) numbers are for the fiscal year ending in January.
Walmart (WMT) Research & Development (R&D) Spending Analysis 2016
R&D; spending analysis for Walmart is not available because either the company does not provide the data or we don’t have it.
Walmart (WMT) Sales, Marketing, General & Administrative (SG&A) Spending Analysis From…
This report provides the last five years sales, marketing, general & administrative (SG&A;) expenses of Wal-Mart Stores Inc (WMT) from 2012 to 2016. Walmart spent a total of $97 billion on sales, marketing, general, and administrative (SG&A;) activities during 2016. Walmart generated a total of $482.1 billion revenues during 2016. As a percentage of revenues, Walmart spent 20.1% of its total revenues on SG&A; activities during 2016. The SG&A; spending numbers are for the fiscal year ending in January.
WORKING CAPITAL ANALYSIS

Walmart (WMT) Inventory Spending Analysis From 2012 To 2016
This report provides the last five years inventory spending analysis of Wal-Mart Stores Inc (WMT) from 2012 to 2016. Walmart invested a total of $44.5 billion on inventories during 2016. Walmart generated a total of $482.1 billion revenues during 2016. As a percentage of revenues, Walmart invested 9.2% of its total revenues on inventories during 2016. The inventory numbers are for the fiscal year ending in January.
Walmart (WMT) Accounts Receivable (A/R) Analysis From 2012 To 2016
This report provides the last five years Accounts Receivable (A/R) analysis of Wal-Mart Stores Inc (WMT) from 2012 to 2016. Walmart invested a total of $5.6 billion on accounts receivable during 2016. Walmart generated a total of $482.1 billion revenues during 2016. As a percentage of revenues, Walmart invested 1.2% of its total revenues on accounts receivable during 2016. The accounts receivable numbers are for the fiscal year ending in January.
Walmart (WMT) Accounts Payable (A/P) Analysis From 2012 To 2016
This report provides the last five years Accounts Payable (A/P) analysis of Wal-Mart Stores Inc (WMT) from 2012 to 2016. Walmart invested a total of $38.5 billion on accounts payable during 2016. Walmart generated a total of $482.1 billion revenues during 2016. As a percentage of revenues, Walmart invested 8% of its total revenues on accounts payable activities during 2016. The accounts payable numbers are for the fiscal year ending in January.
ASSET MANAGEMENT ANALYSIS

Walmart (WMT) Property, Plant & Equipment (PP&E) Investment Analysis From 2012…
This report provides the last five years property, plant & equipment (PP&E;) investment analysis of Wal-Mart Stores Inc (WMT) from 2012 to 2016. Walmart invested a total of $116.5 billion on property, plant & equipment (PP&E;) activities during 2016. Walmart generated a total of $482.1 billion revenues during 2016. As a percentage of revenues, Walmart invested 24.2% of its total revenues on PP&E; activities during 2016. The PP&E; investment numbers are for the fiscal year ending in January.
Walmart (WMT) Intangible Assets Analysis From 2012 To 2016
This report provides the last five years Intangible assets analysis of Wal-Mart Stores Inc (WMT) from 2012 to 2016. Walmart invested a total of $16.7 billion on Intangible assets during 2016. Walmart generated a total of $482.1 billion revenues during 2016. As a percentage of revenues, Walmart invested 3.5% of its total revenues on intangible assets during 2016. The Intangible asset numbers are for the fiscal year ending in January.


