
WD-40 Company develops and sells maintenance products, and home care and cleaning products. It offers multi-purpose maintenance products, including aerosol sprays, non-aerosol trigger sprays, and in liquid form under the WD-40 Multi-Use brand for various consumer uses; and specialty maintenance products that comprise penetrants, degreasers, corrosion inhibitors, lubricants, and rust removers under the WD-40 Specialist brand name. The company also provides products under the WD-40 Bike product brand consisting of wet and dry chain lubricants, heavy-duty degreasers, and foaming wash products for avid and recreational cyclists, bike enthusiasts, and mechanics; multi-purpose and specialty drip oils, and spray lubricant products, as well as other specialty maintenance products under the 3-IN-ONE brand; and professional spray maintenance products and lubricants for the bike market under the GT85 brand. In addition, it offers liquid mildew stain removers and automatic toilet bowl cleaners under the X-14 brand; automatic toilet bowl cleaners under the 2000 Flushes brand; and a range of room and rug deodorizers sold as powder, aerosol quick-dry foam, and trigger spray products under the Carpet Fresh and No Vac brands. Further, the company provides aerosol carpet stain removers, and liquid trigger carpet stain and odor eliminator products under the Spot Shot brand; carpet and household cleaners, and rug and room deodorizers under the 1001 brand; and hand cleaner products under the Lava and Solvol brand names. It offers products primarily through mass retail and home center stores, warehouse club stores, grocery stores, hardware stores, automotive parts outlets, sport retailers, independent bike dealers, online retailers, and industrial distributors and suppliers in the Americas, Europe, the Middle East, Africa, and the Asia-Pacific. The company was founded in 1953 and is headquartered in San Diego, California.
BUSINESS ANALYSIS OF WD-40
The Basic Materials Sector is witnessing a major shakeup, new age business models in the industry are transforming both customers and businesses. Faced with this uncertainity, companies are investing resources to transform their business. An in-depth business analysis is a valuable resource to identify and articulate the need for a business model change. At R&P Research we believe, the starting point for a business analysis is Benchmarking. Business benchmarking can be done at various levels: 1) Industry Benchmarking 2) Peer Benchmarking 3) Disruptors Benchmarking. In this report, we share the snapshot of how Wd-40 compares against the industry on the major performance indicators. This analysis, along with peer group/disruptors benchmarking and revenue model understanding can help identify growth and cost optimization opportunities to maximize the value delivered by Wd-40 to its stakeholders. R&P Research Industry Intelligence Platform provides historical data for last 15 years with an easy to use benchmarking interface for an in-depth comparative business analysis.
- Revenue Growth: Wd-40 reported a revenue growth of 0.7% year-on-year during 2016. Chemicals Industry grew at -4.1% in the same period
- COGS share of Revenues: As a percentage of revenue, Wd-40 spent 43.7% of its total revenues on COGS. Chemicals industry average (COGS share of revenue) in the same period was 70.2%
- R&D; share of Revenues: Wd-40 R&D; share of Revenues details are not available because either company does not share the data or we do not have it
- SG&A; share of Revenues: As a percentage of revenue, Wd-40 spent 36.8% of its total revenues on Sales, Marketing, and General Administration (SG&A;). Chemicals industry average SG&A; spending in the same period was 13.0%
- Inventory share of Revenues: As a percentage of revenue, Wd-40 spent 8.4% of its total revenues on Inventories. Chemicals industry average Inventory spending in the same period was 14.6%
- Accounts Payable share of Revenues: As a percentage of revenue, Wd-40 invested 4.9% of its total revenues on Accounts Payable (A/P) Chemicals industry average Accounts Payable investment in the same period was 12.6%
- Accounts Receivable share of Revenues: As a percentage of revenue, Wd-40 invested 17.0% of its total revenues on Accounts Receivable (A/R). Chemicals industry average Accounts Receivable investment in the same period was 16.8%
- PP&E; share of Revenues: As a percentage of revenue, Wd-40 invested 3.0% of its total revenues on Property, Plants, and Equipments (PP&E;). Chemicals industry average PPE investment in the same period was 52.9%
- Intangibles share of Revenues: As a percentage of revenue, Wd-40 invested 30.2% of its total revenues on Intangibles. Chemicals industry average Intangibles investment in the same period was 31.4%
- Net Margins: Wd-40 Net Margins in the year 2016 were 13.8%. Chemicals industry average Net Margins in the same period were 8.1%
SECTOR AND INDUSTRY ASSOCIATION OF WD-40
For the purpose of performance benchmarking of a company with a sector or industry average, R&P; Research associates every company with one sector and one industry. An industry consists of companies with related/similar business models. A sector comprises of a group of related/similar industries.
Wd-40 is associated with Basic Materials Sector and Chemicals Industry.
Basic Materials sector is comprised of the following industries: Metal Mining; Coal Mining; Chemicals. The definitions for each of the industries is as follows:
- Metal Mining industry includes companies primarily engaged in mining, developing mines, or exploring for precious metals such as Gold, Silver, Platinum and base metals such as Iron, Copper, Aluminum, Lead, and Zinc. It also includes companies that manufacture alloys such as steel.
- Coal Mining industry includes companies engaged in the exploration for and/or mining of coal.
- Chemicals industry includes companies that produce and/or distribute commodity and specialty chemicals. The companies manufacture three general classes of products: (1) basic chemicals, such as acids, alkalies, salts, and organic chemicals; (2) chemical products to be used in further manufacture, such as synthetic fibers, plastics materials, dry colors, and pigments; and (3) finished chemical products to be used as materials or supplies in other industries, such as paints, fertilizers, and explosives.

INDUSTRY RANKING OF WD-40
With $380.7 million revenues, Wd-40 ranked number 58 of all the companies in the US Chemicals industry. There were a total of 66 public companies in the US Chemicals industry that had revenues greater than $50 million during 2016.
The top-10 companies in the US Chemicals industry by revenues during 2016 were:
- Dow Chemical ($48.2 billion)
- Lyondellbasell Industries ($29.2 billion)
- DuPont ($24.6 billion)
- PPG Industries ($14.8 billion)
- Monsanto ($13.5 billion)
- Sherwin Williams ($11.9 billion)
- Praxair ($10.5 billion)
- Huntsman ($9.7 billion)
- Air Products ($9.5 billion)
- Eastman ($9 billion)

BUSINESS MODEL ANALYSIS (BMA) FRAMEWORK
We use the following framework to assess the business model of a company. Business Model Analysis framework can be used by organizations to articulate growth strategies and identify cost optimization opportunities. Technology and consulting companies can use this framework to identify the value drivers and pain points of their targeted customers. Entrepreneurs can use this framework to understand the language of business and identify promising business opportunities. This framework can be used by any professional aspiring to take up a leadership role to better understand the businesses challenges, articulate growth strategy, and monitor the business improvement requirements for the organization.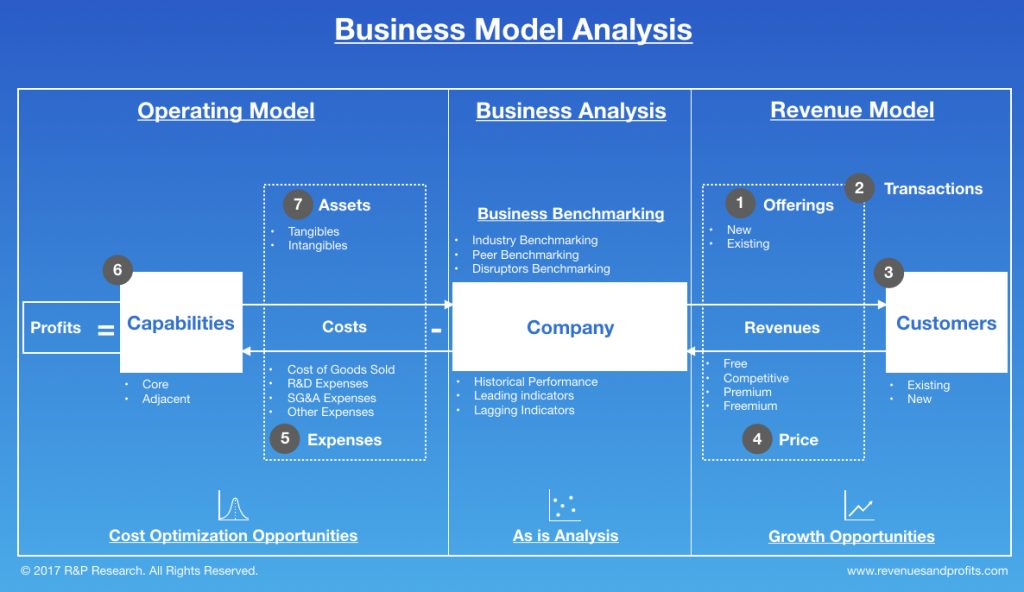
NEXT STEPS
- Conduct a holistic benchmarking; to identify and target additional sources of value
- Get in touch with us to learn more about Business Model Analysis Framework
- Get free data, charts, and analysis of Wd-40and its peers on select key performance indicators by clicking the reports provided below
INDUSTRY PEERS AND COMPETITORS OF WD-40

Ciner Resources (CINR) Business Analysis – Analyze Historical Performance, Strategic Priorities,…
Ciner Resources Lp with $475 million revenues in the year 2016 was the number 55 Chemicals company. Read this report to know the top competitors of Ciner Resources and identify growth and cost optimization opportunities of Ciner Resources
Terra Nitrogen (TNH) Business Analysis – Analyze Historical Performance, Strategic Priorities,…
Terra Nitrogen Company with $418 million revenues in the year 2016 was the number 56 Chemicals company. Read this report to know the top competitors of Terra Nitrogen and identify growth and cost optimization opportunities of Terra Nitrogen
Hawkins (HWKN) Business Analysis – Analyze Historical Performance, Strategic Priorities, And…
Hawkins Inc with $414 million revenues in the year 2016 was the number 57 Chemicals company. Read this report to know the top competitors of Hawkins and identify growth and cost optimization opportunities of Hawkins
CVR Partners (UAN) Business Analysis – Analyze Historical Performance, Strategic Priorities,…
CVR Partners, Lp with $356 million revenues in the year 2016 was the number 59 Chemicals company. Read this report to know the top competitors of CVR Partners and identify growth and cost optimization opportunities of CVR Partners
American Vanguard (AVD) Business Analysis – Analyze Historical Performance, Strategic Priorities,…
American Vanguard Corp with $312 million revenues in the year 2016 was the number 60 Chemicals company. Read this report to know the top competitors of American Vanguard and identify growth and cost optimization opportunities of American Vanguard
KMG Chemicals (KMG) Business Analysis – Analyze Historical Performance, Strategic Priorities,…
KMG Chemicals Inc with $298 million revenues in the year 2016 was the number 61 Chemicals company. Read this report to know the top competitors of KMG Chemicals and identify growth and cost optimization opportunities of KMG Chemicals
REVENUES ANALYSIS

Wd-40 (WDFC) Revenues And Revenue Growth From 2012 To 2016
This report provides the last five years revenues and revenue growth of Wd-40 Company (WDFC) from 2012 to 2016. Wd-40 generated a total of $380.7 million revenues during 2016. Wd-40 reported a revenue growth of 0.7% year-over-year during 2016. The revenues and the revenue growth correspond to the fiscal year ending in August.
Wd-40 (WDFC) Revenues And Revenue Growth From 2002 To 2016
This report provides the last fifteen years revenues and revenue growth of Wd-40 Company (WDFC) from 2002 to 2016. Wd-40 generated a total of $380.7 million revenues during 2016. Wd-40 reported a revenue growth of 0.7% year-over-year during 2016. The revenues and the revenue growth correspond to the fiscal year ending in August.
Wd-40 (WDFC) Revenue Growth Comparison With Industry Growth From 2012 To…
This report provides a comparison of Wd-40 Company (WDFC) revenue growth with Chemicals industry growth during the last five years from 2012 to 2016. Wd-40 reported a revenue growth of 0.7% year-over-year during 2016. The Chemicals industry growth was -4.1% year-over-year during 2016. Wd-40 growth was faster than the industry during 2016.
PROFIT ANALYSIS

Wd-40 (WDFC) Net Profit And Net Margin From 2012 To 2016
This report provides the last five years net profit and net margin of Wd-40 Company (WDFC) from 2012 to 2016. Wd-40 reported a total net income of $52.6 million during 2016. Wd-40 generated a total of $380.7 million revenues during 2016. Wd-40 net profit margin was 13.8% during 2016. The net profit and the net profit margin correspond to the fiscal year ending in August.
Wd-40 (WDFC) Net Profit And Net Margin From 2002 To 2016
This report provides the last fifteen years net profit and net margin of Wd-40 Company (WDFC) from 2002 to 2016. Wd-40 reported a total net income of $52.6 million during 2016. Wd-40 generated a total of $380.7 million revenues during 2016. Wd-40 net profit margin was 13.8% during 2016. The net profit and the net profit margin correspond to the fiscal year ending in August.
Wd-40 (WDFC) Net Profit Margin Comparison With Industry From 2012 To…
This report provides a comparison of Wd-40 Company (WDFC) net profit margin with Chemicals industry net profit margin during the last five years from 2012 to 2016. Wd-40 reported a net profit margin of 13.8% during 2016. The Chemicals industry net profit margin was 8.1% during 2016. Wd-40 was more profitable than the industry during 2016.
COST & EXPENSES ANALYSIS

Wd-40 (WDFC) Cost of Sales (COGS) Analysis From 2012 To 2016
This report provides the last five years cost of sales (COGS) analysis of Wd-40 Company (WDFC) from 2012 to 2016. Wd-40 spent a total of $166.3 million on COGS during 2016. Wd-40 generated a total of $380.7 million revenues during 2016. As a percentage of revenues, Wd-40 spent 43.7% of its total revenues on COGS during 2016. The cost of sales (COGS) numbers are for the fiscal year ending in August.
Wd-40 (WDFC) Research & Development (R&D) Spending Analysis 2016
R&D; spending analysis for Wd-40 is not available because either the company does not provide the data or we don’t have it.
Wd-40 (WDFC) Sales, Marketing, General & Administrative (SG&A) Spending Analysis From…
This report provides the last five years sales, marketing, general & administrative (SG&A;) expenses of Wd-40 Company (WDFC) from 2012 to 2016. Wd-40 spent a total of $140 million on sales, marketing, general, and administrative (SG&A;) activities during 2016. Wd-40 generated a total of $380.7 million revenues during 2016. As a percentage of revenues, Wd-40 spent 36.8% of its total revenues on SG&A; activities during 2016. The SG&A; spending numbers are for the fiscal year ending in August.
WORKING CAPITAL ANALYSIS

Wd-40 (WDFC) Inventory Spending Analysis From 2012 To 2016
This report provides the last five years inventory spending analysis of Wd-40 Company (WDFC) from 2012 to 2016. Wd-40 invested a total of $31.8 million on inventories during 2016. Wd-40 generated a total of $380.7 million revenues during 2016. As a percentage of revenues, Wd-40 invested 8.4% of its total revenues on inventories during 2016. The inventory numbers are for the fiscal year ending in August.
Wd-40 (WDFC) Accounts Receivable (A/R) Analysis From 2012 To 2016
This report provides the last five years Accounts Receivable (A/R) analysis of Wd-40 Company (WDFC) from 2012 to 2016. Wd-40 invested a total of $64.7 million on accounts receivable during 2016. Wd-40 generated a total of $380.7 million revenues during 2016. As a percentage of revenues, Wd-40 invested 17% of its total revenues on accounts receivable during 2016. The accounts receivable numbers are for the fiscal year ending in August.
Wd-40 (WDFC) Accounts Payable (A/P) Analysis From 2012 To 2016
This report provides the last five years Accounts Payable (A/P) analysis of Wd-40 Company (WDFC) from 2012 to 2016. Wd-40 invested a total of $18.7 million on accounts payable during 2016. Wd-40 generated a total of $380.7 million revenues during 2016. As a percentage of revenues, Wd-40 invested 4.9% of its total revenues on accounts payable activities during 2016. The accounts payable numbers are for the fiscal year ending in August.
ASSET MANAGEMENT ANALYSIS

Wd-40 (WDFC) Property, Plant & Equipment (PP&E) Investment Analysis From 2012…
This report provides the last five years property, plant & equipment (PP&E;) investment analysis of Wd-40 Company (WDFC) from 2012 to 2016. Wd-40 invested a total of $11.5 million on property, plant & equipment (PP&E;) activities during 2016. Wd-40 generated a total of $380.7 million revenues during 2016. As a percentage of revenues, Wd-40 invested 3% of its total revenues on PP&E; activities during 2016. The PP&E; investment numbers are for the fiscal year ending in August.
Wd-40 (WDFC) Intangible Assets Analysis From 2012 To 2016
This report provides the last five years Intangible assets analysis of Wd-40 Company (WDFC) from 2012 to 2016. Wd-40 invested a total of $114.8 million on Intangible assets during 2016. Wd-40 generated a total of $380.7 million revenues during 2016. As a percentage of revenues, Wd-40 invested 30.2% of its total revenues on intangible assets during 2016. The Intangible asset numbers are for the fiscal year ending in August.


